pcolor
Display a matrix as a heat map. The values of input matrix z are mapped to the colors of the colormap.
Syntax
h = pcolor(z)
h = pcolor(x, y, z)
h = pcolor(hAxes, ...)
Inputs
- x, y, z
- Range of the x, y, and z axes.
- hAxes
- Axis handle.
Outputs
- h
- Handle of the surface graphics object.
Examples
cla;
x = 1:5;
y = 1:5;
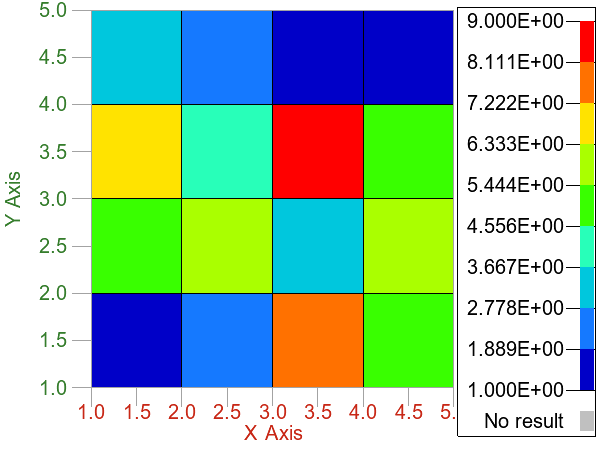
z = [1 2 8 5 7; 5 6 3 6 7; 7 4 9 5 3; 3 2 1 1 6; 5 6 8 1 3];
ph = pcolor(x, y, z);
Figure 1. pcolor plot - discrete colors
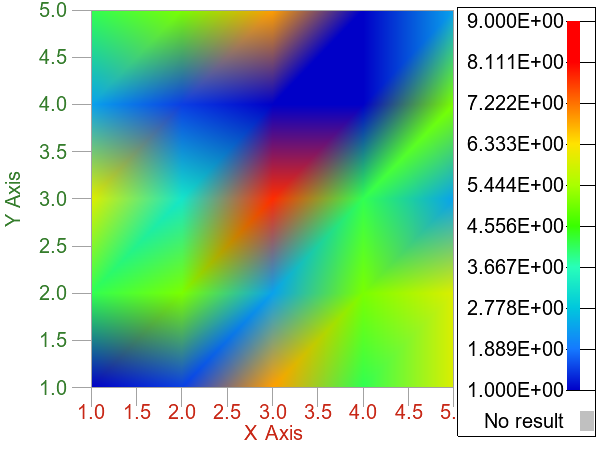
pcolor plot with blended colors. If the 'contourtype' is set to 'blended', the color of each cell is calculated by interpolating the colors of the cell's vertices.
cla;
x = 1:5;
y = 1:5;
z = [1 2 8 5 7; 5 6 3 6 7; 7 4 9 5 3; 3 2 1 1 6; 5 6 8 1 3];
ph = pcolor(x, y, z);
set(gca,'contourtype','blended');
Figure 2. pcolor plot - blended colors
Comments
If there are no axes, they will be created first. If x and y are omitted, the index of the z column is used for x coordinates, and the index of the z row is used for y coordinates.