scatter3
Creates 3D dots in an axes and returns handles of the dots.
Syntax
h = scatter3(x, y, z)
h = scatter3(..., color)
h = scatter3(..., style)
h = scatter3(..., property, value, ...)
h = scatter3(hAxes, ...)
Inputs
- x, y, z
- Range of the x, y, and z axes.
- color
- Color of the scattered dots.
- style
- Style of the scattered dots.
- property
- Properties that control the appearance or behavior of the graphics object.
- value
- Value of the properties.
- hAxes
- Axis handle. .
Outputs
- h
- Handle of the scatter graphics object.
Examples
Simple scatter3
example:
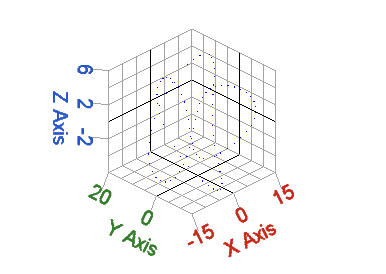
Figure 1. Scatter3 plot
clf;
u = [0:(pi/50):(2*pi)];
x=sin(2*u).*(10.0 + 6*cos(3*u));
y=cos(2*u).*(10.0 + 6*cos(3*u));
z=6*sin(3*u);
scatter3(x, y, z)
Figure 1. Scatter3 plot
Simple scatter3 example with
options:
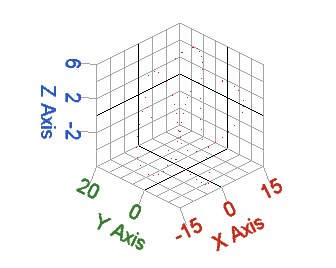
Figure 2. Scatter3 plot with options
clf;
u = [0:(pi/50):(2*pi)];
x=sin(2*u).*(10.0 + 6*cos(3*u));
y=cos(2*u).*(10.0 + 6*cos(3*u));
z=6*sin(3*u);

p=scatter3(x,y,z)
get(p)
set(p, 'marker', 'v')
set(p, 'markerfacecolor', [255 5 5])
Figure 2. Scatter3 plot with options
Comments
If there is no axes, one will be created first. Scatter3 takes optional arguments to control the dots style. It can be either the size of the dots (not supported yet), or the color of the dots (not supported yet), or the style of the dots, or “filled, ..."(not supported yet), or property/value pair(s), or all of them. If the first argument of scatter3() is an axes handle, lines will be created in that axes.