Plot
Click ![]() to plot responses from the analysis.
to plot responses from the analysis.
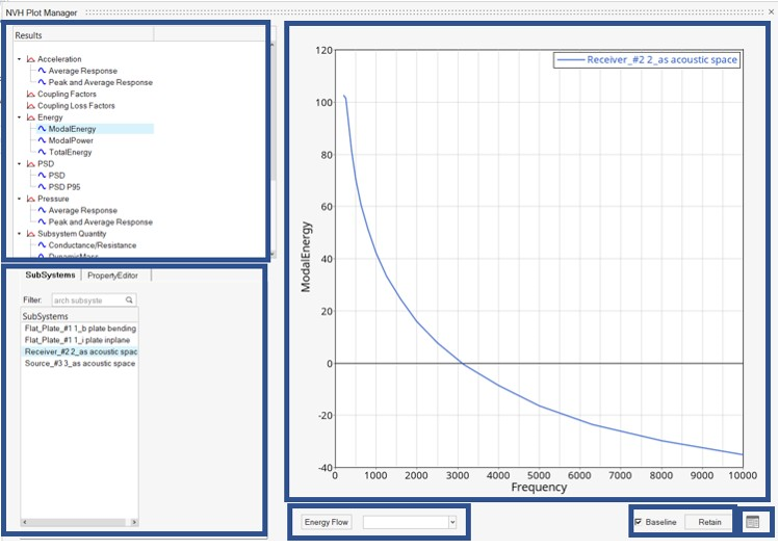
Figure 1. NVH Plot Manager
Use the Plot Manager to plot SEAM results. You can plot model results versus a baseline model or overlay plots from different elements or connections within the same model. The plot controls vary depending on the quantity presented.
Plot Manager has three sections:
- Results
- Results contains the list of responses available from solving the loaded model.
-
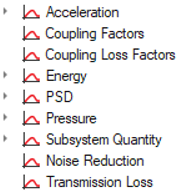
Figure 2. - Subsystems
- After selecting the result type, select a subsystem.
- Plot
- Display results of the analysis in a 2D plot.
-
- Energy Flow
- Present the energy flow for a subsystem after running a model. The energy flow into a given subsystem is plotted versus the connected subsystem and is displayed in the SEAM Energy Flow Graph window. A positive value represents energy flow into the subsystem, and a negative value represents energy flow out of the subsystem.
-
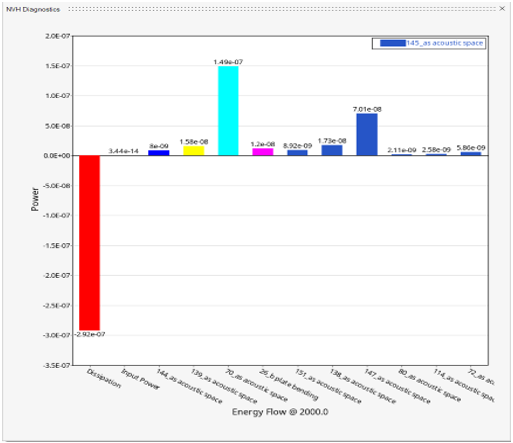
Figure 3. Energy Flow - Retain
- Save the results of the baseline and compare it against the latest run. By clicking on the baseline, you can view or hide the baseline results in the current plot.
- Table View
- Provides a spreadsheet view of the SEAM results. This view displays the actual numerical values of the calculated quantities. You can also export the result into a CSV format as shown below.
-
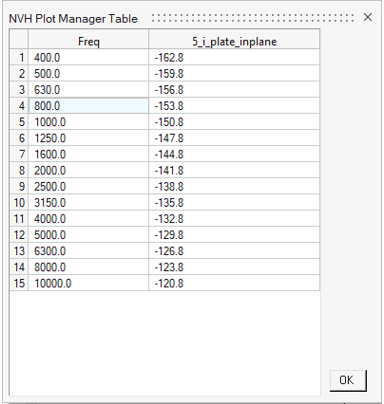
Figure 4. NVH Plot Manager Table