Create a Plot from CSV files
RVS supports plotting of visualization data stored using CSV (comma-separated values) files.
To plot a CSV file, have your CSV files uploaded in the
Files tab.
You can apply a template to view your CSV plot result and also create a new template using the CSV plot parameters.
If you have a default template set for a CSV plot file, you will be navigated to the plot result if the default template is valid for the selected result file. If a template cannot be applied to a result file, a message is displayed to select another valid template.
-
Right-click a CSV file and then click .
The Table of Contents (TOC) pop-up screen is displayed.
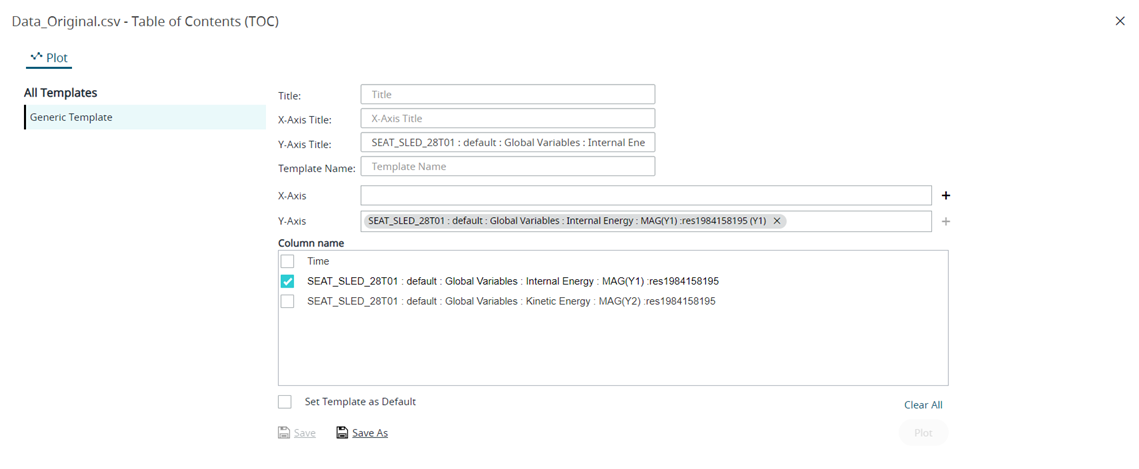
Figure 1. Table of ContentsThe variables of the plot data values are displaying under Column name.
-
For X-Axis parameters, to choose different parameters click
 located to the right of the field.
Note: By default, the first entry in the result parameters list is considered for a plot.
located to the right of the field.
Note: By default, the first entry in the result parameters list is considered for a plot. -
Click Plot.
Tip: Click
 to clear the
Y-axis selections.The plot is generated and displayed.
to clear the
Y-axis selections.The plot is generated and displayed.