Hide a Curve from the Plot View

You can show and hide the curves from the plot view.

The legend of a curve allows you to hide and show the curve from the plot view. You can hide a plot using the plot name in the legend, this will hide all the curves related to the plot.
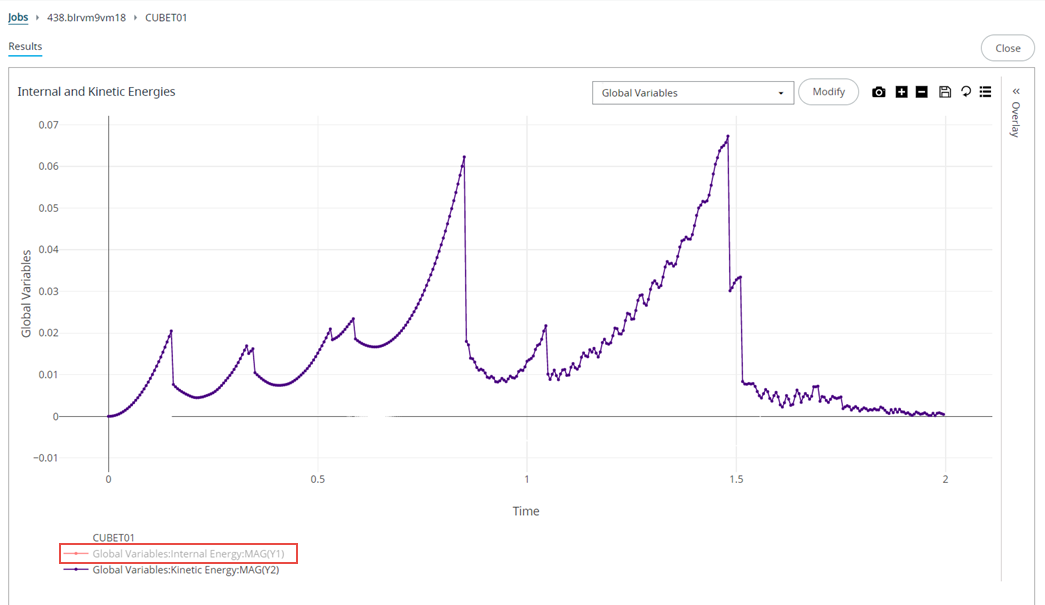
  1. To hide a curve, click its legend.
    The legend is grayed out and the curve is hidden. The other curves are still visible for analyzing the plot details.

    Curve Legend
  2. To view a hidden curve, click its legend again.
    The hidden curve is displayed on the plot.