Create a Plot from the Job Output Tab
You can create and visualize plots from the result files of a completed job.
The job result files that are saved in Job ID folder are stored under the Files tab in the same location where the input files are placed. Hence, the results files are available from both the tabs for visualization.
-
Right-click a plot result file and then click .
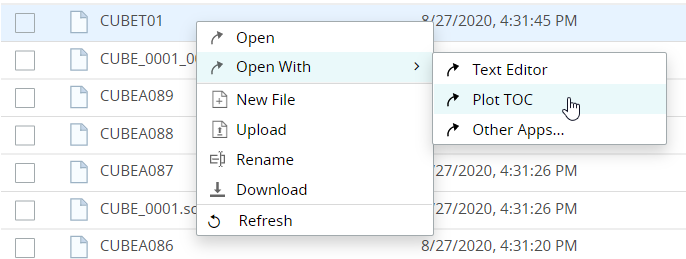
Figure 1. Plot TOC MenuThe Table of Contents (TOC) is displayed.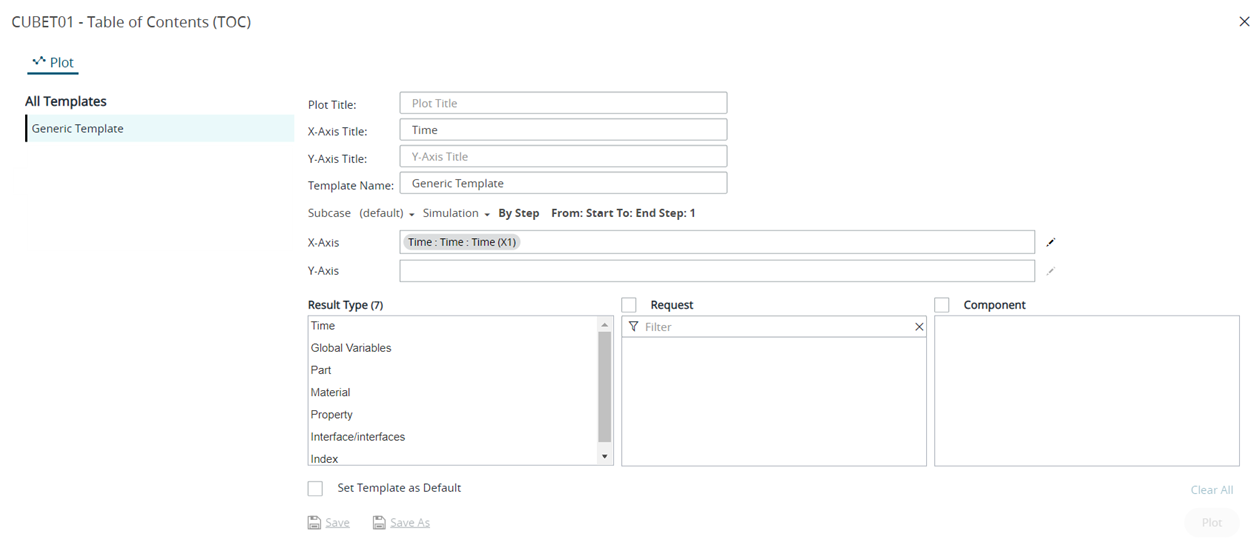
Figure 2. Table of Contents for a Plot - Optional:
Click Simulation to select a simulation query.
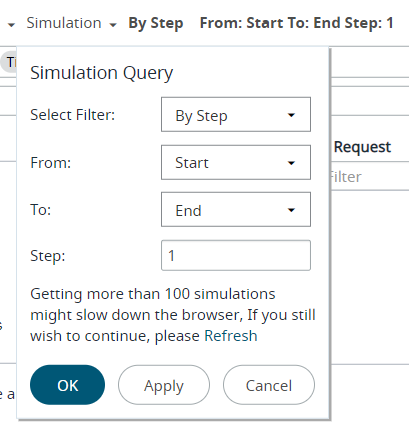
Figure 3. Plot Simulation Query Menu -
For X-Axis parameters, to choose different parameters click
 located to the right of the field.
Note: By default, the first entry in the result parameters list is considered for a plot.
located to the right of the field.
Note: By default, the first entry in the result parameters list is considered for a plot. -
For Y-Axis, select the required parameters from the Result
Type, Request and
Component sections.
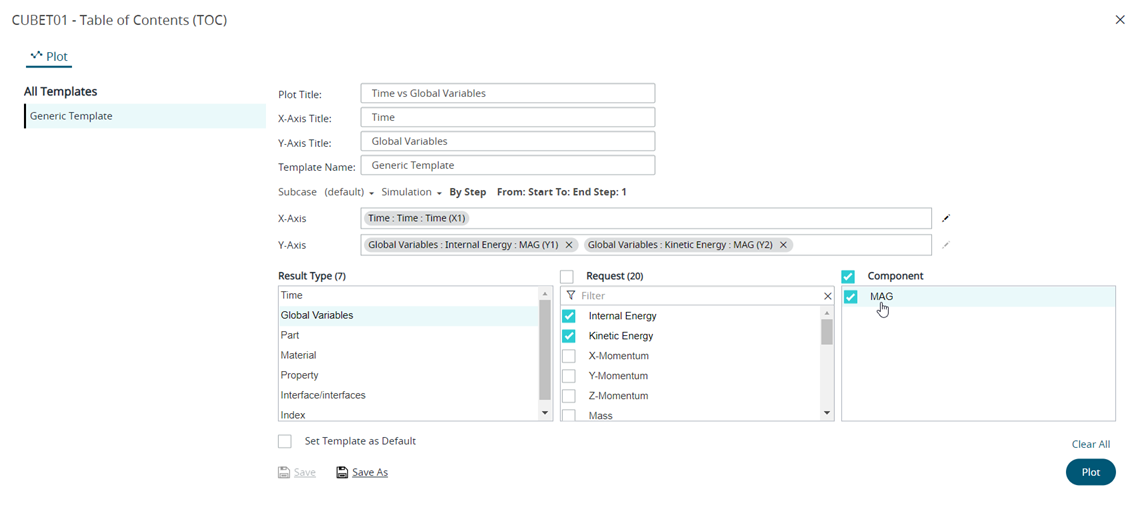 Figure 4. Select Plot ParametersThe selected components are added as X-axis and Y-axis variables.Tip: Click
 to clear the Y-axis selections.
-
Click Plot.
The plot result is displayed for the selected parameters. The Last Submitted template is updated with the selected parameters and is also displayed in the Template drop-down list as shown here:
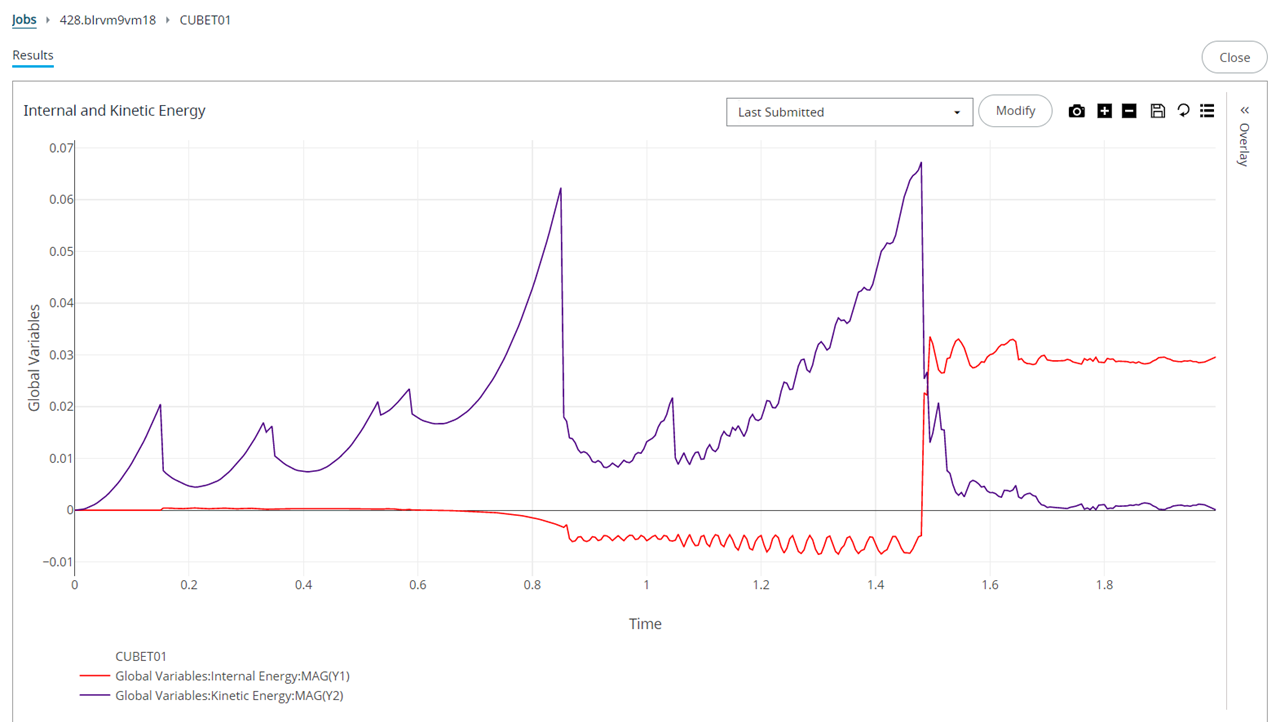
Figure 5. Plot ResultTip: Click to return to the plot TOC to modify the plot
parameters.
to return to the plot TOC to modify the plot
parameters.