Adjust the Plot View
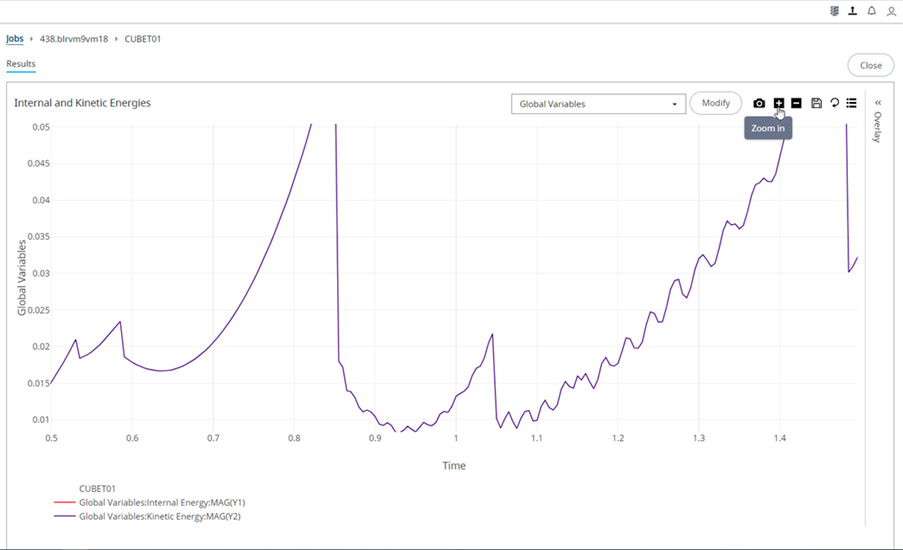
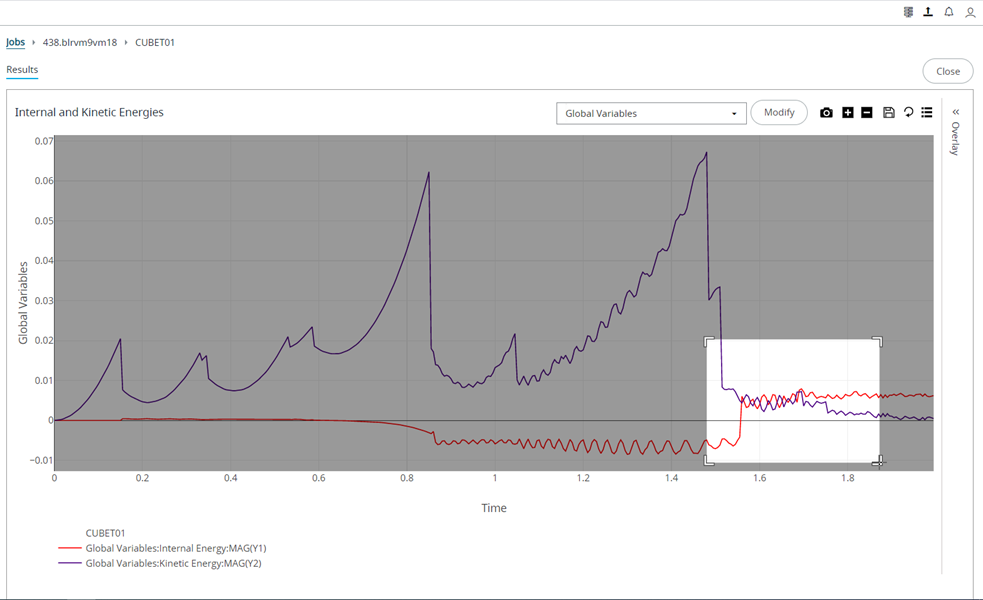
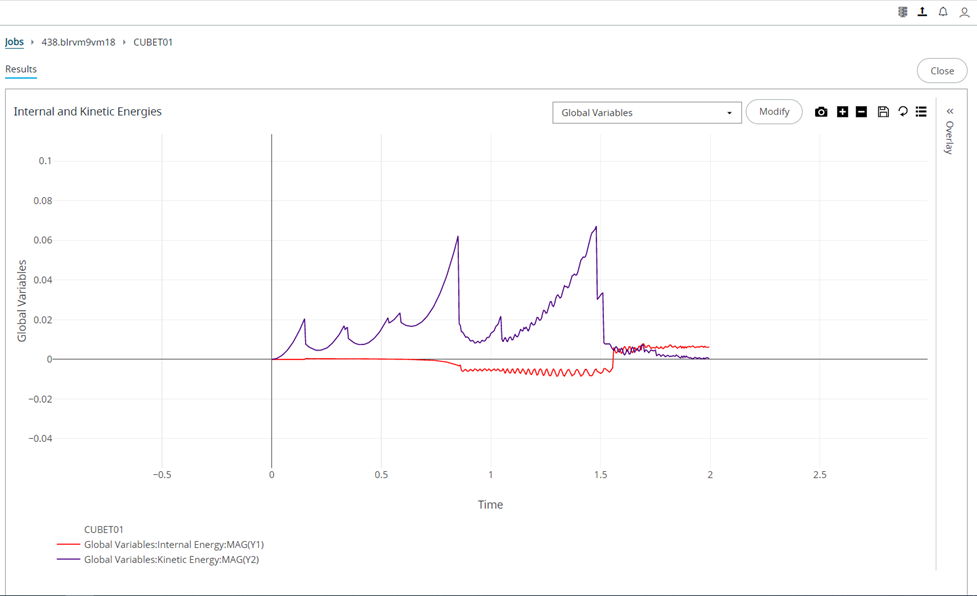
The Zoom in and Zoom out buttons enable you to adjust and view the details of a plot.
New features available in Altair Access™ Web.
Use Access Web to submit jobs to a Workload Manager.
Video tutorials to help you get started with Altair Access Web.
Access Web is supported on the following web browsers.
Login to Access Web so that you can submit and monitor jobs.
Schedule jobs to run on an HPC cluster by submitting them to the Workload Manager.
Monitor the status of your jobs, filter the job view, view job details, monitor memory and core utilization, view a list of job files, or perform job actions.
Move job to a different queue, terminate, remove unwanted jobs, resubmit and download jobs.
Manage the jobs files by creating a new file, remove unwanted job files, downloading job files, viewing or editing a file.
Create, view and remove job profiles.
Add, update, or delete HPC clusters.
Create, manage, and navigate to your bookmark.
Organize and manage your job files.
Flexibility when you view the list view in Files and Jobs tab.
Create a remote desktops by submitting an interactive job and manage open remote desktops.
Visualize plots and animations from the result files.
You may visualize your results from the Files and Jobs tabs.
Plot Templates are customized shortcuts for viewing the plot result file.
You can generate plots from the Job Summary tab for both running and completed jobs.
You can create and visualize plots from the result files of a completed job.
A plot can be generated from a running job file. As the job progresses you can view the latest plot data of a running job.
You may visualize the result files from the Files tab.
RVS supports plotting of visualization data stored using CSV (comma-separated values) files.
Create, modify, and remove plot templates.
The Zoom in and Zoom out buttons enable you to adjust and view the details of a plot.
You can reset the plot to its original view.
You can use the Log X and Log Y options to change the X and Y axis to logarithmic scale.
Use this option to show and hide the data points on the plot.
Use this option to export the plot data into a CSV (comma-separated values) file.
Refresh is used to manually refresh the plot.
You can show and hide the curves from the plot view.
You can download the plot view as an image (PNG format).
You can save the plot you generated with the data as a .rvs file.
You can view your saved .rvs plots.
Compare two or more plots in the Results window. You can use the plot options while comparing to analyze the plot results.
You may visualize your completed results from the Files and Jobs tabs.
The result file types supported by RVS for visualizing plot and animation.
View site specific pages in Access Web.
View notification messages that are displayed for various events.
Access Web provides an easy way to create a user defined application definition (app def) using the App Composer.
Set the user Access Web preferences.
View the Access Web Application Version.
View information about other Altair products such as Access Desktop and Access Mobile.
Create roles and add users to these roles to grant and restrict access to the various features of Access Web.
Audit Log provides an easy way to view record of actions happening in Access Web.
Share audit logs with Altair for troubleshooting Access Web.
Provide feedback from the Access Web application.
Change the password that you use to login to the machine hosting Access Web.
Provide a password once eliminating the need to continually authenticate to the Windows HPC complex.
Visualize plots and animations from the result files.
You may visualize your results from the Files and Jobs tabs.
The Zoom in and Zoom out buttons enable you to adjust and view the details of a plot.
The Zoom in and Zoom out buttons enable you to adjust and view the details of a plot.


The plot view is adjusted and displays only the selected plot area.

© 2022 Altair Engineering, Inc. All Rights Reserved.
Intellectual Property Rights Notice | Technical Support | Cookie Consent