2D Curve: framing of the curves, operation modes of the pointer
What can be done
The available capabilities are as follows:
- Framing on the two axis (zoom)
- Framing on one axis (zoom on an axis)
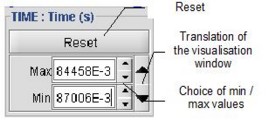
- Translation of the visualization window
Pointer operation
The pointer operation modes (of the mouse) in the display zone are presented in the table below.
| mode | Icon | function |
|---|---|---|
| cursor |
|
By default mode |
| Zoom |
|
|
| Translation on the axes |
|
|
![]() The button Reset permits to retrieve the initial framing.
The button Reset permits to retrieve the initial framing.
Zooming by framing
To carry out a zoom by framing:
| Step | Action |
|---|---|
| 0 | Activate the zoom mode |
| 1 | Click on the desired place in the tracing area and maintain the click |
| 2 | Move the cursor to define the desired area |
| 3 | Release the click |
| → |
The zoom of the chosen zone has been carried out For other elementary curves the zoom is done only on the X axis |
Zooming on an axis
To carry out a zoom on an axis:
| Step | Action |
|---|---|
| 0 | Activate the zoom mode |
| 1 | Click on the X or Y axis at the desired departure point and maintain the click |
| 2 | Move the cursor on the axis up to the desired position |
| 3 | Release the click |
| → |
The zoom is done only on the chosen axis, with the other axis remaining at the same scale For a zoom on the axis X, the zoom has impact on each elementary curve For a zoom on the axis Y, the zoom is only carried out on the selected elementary curve (only in the display modes « lit» and « sorted out by formulas ») |
It is equally possible to zoom on one axis by activating the box « Choice of pins » (click right on the desired axis).
Initializing a curve
The user can retrieve the initial framing (initial scales) of an elementary curve by
clicking on the button ![]()
Each elementary curve has its own reset button
Translating the visualization window
To translate the visualization window:
| Step | Action |
|---|---|
| 0 | Carrying out of a zoom |
| 0 | Activate the Translation mode |
| 1 | Click .. |
It is equally possible to translate the visualization window on an axis by activating the box « Choice of pins » (click right on the desired axis).
Choice of pins
To modify the pins on each of the axes the user can activate the box « Choice of pins » (click right on the desired axis).
Hiding/ Displaying the legends
The user can enlarge the tracing zone by hiding the legends by clicking on the corresponding "legend" button .
The legends can be displayed again by a new click.