2D Curve: representation of curves (quantities in X, in Y)
By default representation
By default, all the calculated elementary curves are represented in the tracing zone.
For each of the curves, the representation is the following:
- on abscissa : the calculation support (path, I/O parameter)
- on ordinate : the calculated quantity (formula with local quantity, formula with I/O parameter) *
The calculated quantities are accessible in the quantity tree (formulas zone).
Adding /deleting a curve
To add/delete an elementary curve in the display zone
-
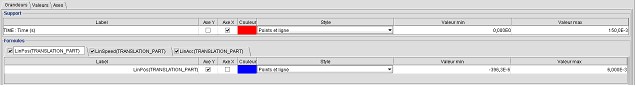
in the Table tab: tick the box « visible » preceding the desired quantity
Modifying the quantities in X, in Y
To modify the representation of the quantities in X and in Y
-
in the tab Table : tick the box Axe X / Axe Y preceding the desired quantity
Modifying the scales
To modify the extremes of the scales:
-
in the tab Axes: choose the min. values, max. values preceding the desired quantity
To pass to the logarithmic scale:
-
in the tab Axes : tick the box Log preceding the desired quantity
Modifying the Style
The user can equally modify the style of the curve displayed by means of the following options:
- by modifying the color
- by modifying the style (line, point, stick, surface…)