Comparison
Comparison is used to compare two models using the Model Verification tool.
-
Click the folder icon and navigate to the model to import (Folder/File
selections).
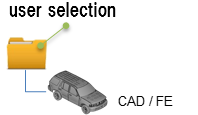
Figure 1. -
Click the folder icon and navigate to the model to import (Folder/File
selections).
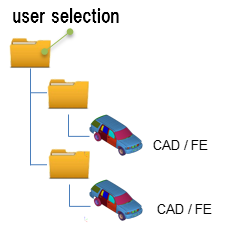
Figure 2. -
Click View Report to display the Summary PowerPoint
report.
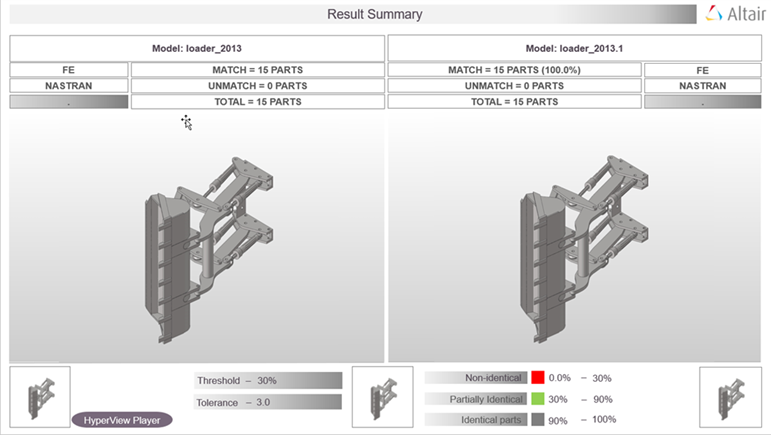
Figure 3. PowerPoint Summary . (Stored in Report Path)The slide shows the comparison between a source assembly and the target assembly. The left half of the image shows the source assembly and the right half of the image shows the target assembly. In the example illustrated above, the source assembly has a total of 39 parts. The target assembly has a total of 38 parts. The matching parts, between the source and target assemblies, are highlighted in black and the unmatched parts are shown in red.
The second slide shows the matched and unmatched results for individual parts. The number of parts are limited to 40 which matches the Excel report. This limitation can be edited in the configuration.
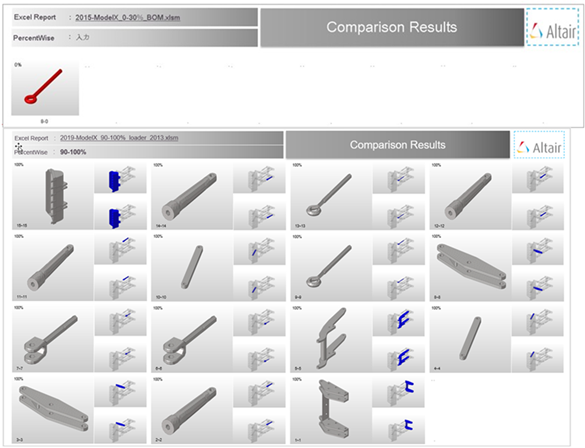
Figure 4. Matched and Unmatched Results. (from 2nd slide of Summary PowerPoint Report)
Output
Overview of the output generated from a Comparison check.
Excel
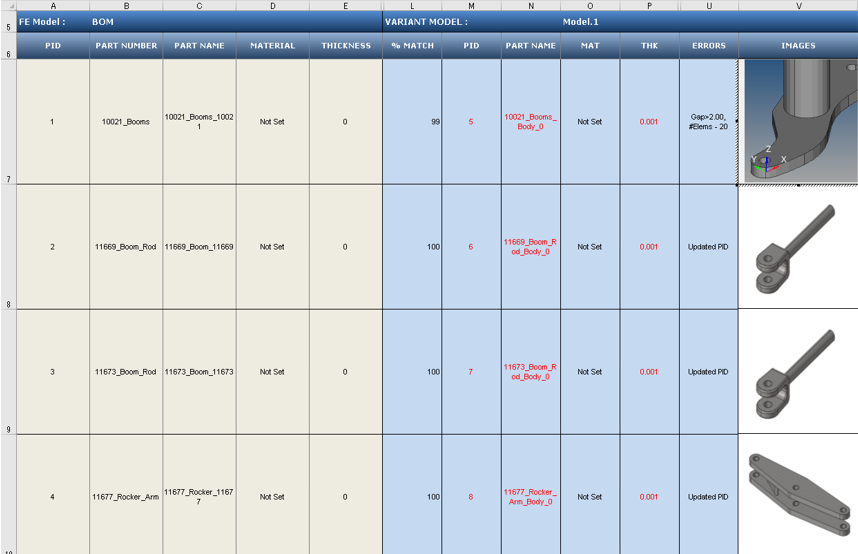
Figure 5.
- Base Model Input
- Input information about each of the parts of the CAD model that the tool uses for performing the a comparison check. The Base Model Input is the first assembly shown in the Part Browser, and can be cross checked at row 5.
- Variant Model Input
- Results of the comparison check. The match percentage column shows a part vise match percentage. If the value of match percentage for a part is 0 or less than the threshold percentage, then the part is said to be unmatched with the corresponding part of the other assembly. If the match percentage is above the threshold value, then the parts are considered matching. The error is reported in the error column. Variant model’s Material name or Thickness values are compared against Base model, mismatch values are shown in red text. Variant Model Input increases depending on the number of Variant model found in the Variant Input folder. Variant model name can be cross checked at row 5.
- Image Type
- Shortcut to the image the part.
- If the image type is JPG, then this shortcut opens the full sized image for viewing.
- If the image type is H3D, then the shortcut opens in the part in H3D format in a new Engineering Solutions window.
Comparison with Browser Selection
Compare CAD vs. CAD models, FE vs. FE models, and CAD vs. FE models with a Comparison check.
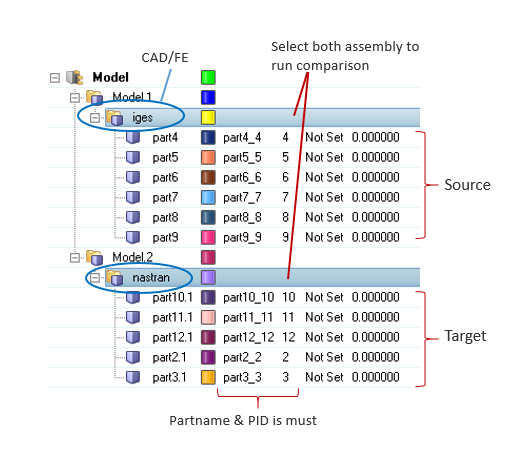
Figure 6. Import Data to Compare
- Comments
-
- During a Comparison check, the part files may get reloaded several times. Converting all models to the HyperMesh format can improve performance. It is recommended that you perform a No-Offset operation before starting the comparison process by selecting .
- During a Comparison check, the part files may get reloaded several times. It is recommended that all models be in HyperMesh format to improve performance. Use the Offset operation before performing a comparison.
- When generating reports, Excel or PowerPoint reports may open several times. It is recommended that you do not to launch or close any Microsoft Office application or use the keyboard during this operation.
- Translation or Smetry comparison runs using 1 CPU. A single CPU is automatically utilized, even when you manually set multiple CPUs.
- If more than one input model is found in the variant folder, a multiple model comparison is activated.
- The folder structure is to be maintained when organizing variant model files. CAD files must be managed under variant folders, and you must select the variant root folder. If the variant root contains more than one sub folder (variants), a multiple model (variant) comparison is activated.
Troubleshoot Model Verification Comparison Check Problems
Approaches used to troubleshoot Model Verification comparison check problems.
- The type of CAD files and the corresponding license required to import the CAD files into Model Verification.
- The tolerance value specified in the GUI (Thickness/2.0).
- Filters specified, such as those in the following list:
- Connection Name Filter
- Area Filter
- CG Filter
- Match % Filter
- Availability of license when using the multiple CPU option. The unit
requirement can be calculated using this formula:
40 + ((No. of CPUs
                            * 21) - 21)
Find which filter parts that are excluded from during comparison.
-
Select .
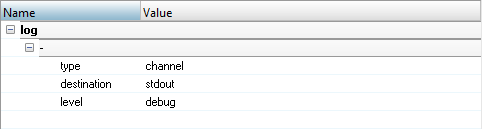
Figure 7. -
Check the Tk Console of the stdout files.
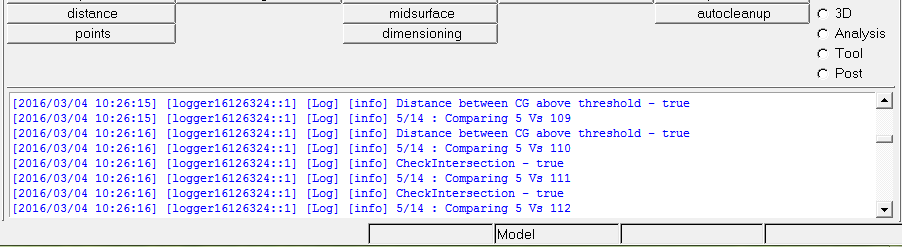
Figure 8.