Axes
Axes can be added to plots using the Axes panel.
Axis attributes such as labels, color, and scaling can be modified using the Axes panel. The panel is displayed when the Axes button is selected from the Annotations toolbar, when you select Axes from the Annotations menu, or when you click on an axis label in a HyperGraph 3D window.
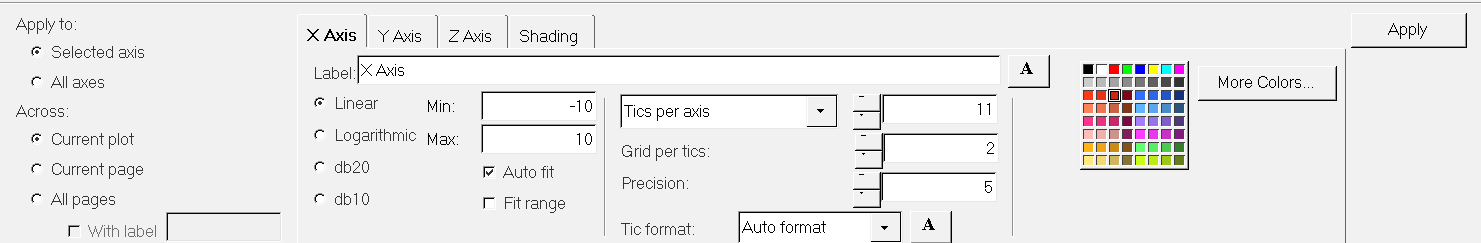
Figure 1.
- Apply to
- You can apply your selections at any point to the Selected axis or to
All Axes.
- Selected axis
- Applies each change to only the axis of the active tab.
- All axes
- Applies each change to the X, Y, and Z axes.
- Across
- You can apply your selections to the Current plot, the Current page, or
All Pages.
- With label
- Located under All Pages, With label only applies each change to the axes that contain the label specified in the With label entry field.
X, Y, and Z Axis Tabs
From the X Axis, Y Axis, or Z Axis tabs, you can apply and edit axis attributes.
- Label
- The axis label is a single line of text displayed alongside the axis in HyperGraph 3D. It is automatically updated in HyperGraph 3D when you enter a new name in the Label field.
- Click the font button,
 , to change the axis label's font.
 - Scales
- Axes can be represented by a Linear, Logarithmic, dB10, or dB20 scale. A
different scale can represent each axis. Use the radio buttons to select
the appropriate scale for each axis.
- dB10
- HyperGraph 3D scales any curve data using the formula Data = 10.0 * log10(Original_Data). If no curves exist on the graph, the minimum value will default to -30 and the maximum to 10.
- dB20
- Curve data is scaled using the formula Data = 20.0 * log10(Original_Data). If no curves exist on the graph, the minimum value will default to -60 and the maximum to 20.
- Minimum and Maximum Values
- When a curve is constructed, the axis minimum and maximum values are set
so that the curve fits in the window by default. When you select a
different axis scale type, the minimum and maximum values automatically
change.
- Min and Max
- New minimum and maximum values can be specified in these fields. Altering the minimum and maximum values for an axis scales the plot along that axis.
- Auto fit
- The selected axis is automatically scaled to fit new curves or bar charts that are added to the axis.
- Fit range
- Restores the current axes values when Fit is selected from the view controls.
- Font Properties
- Click the font button, , to change the font, font style, and size
of the scale type values.
- Color Palette
- Any of the 64 colors can be assigned to the plot axes. After selecting an axis, select a color from the palette to instantly change the color of the axis.
Axis Tics
- Tics per axis
- The number of tics on each axis (or tics per decade if the axis is logarithmic, decibels, or dB10) is controlled by entering a specific number or increment.
- Grids per tic
- If using the linear axis, use Grids per Tic (or Grids per decade if the axis is logarithmic, decibels, or dB10) to change the number of grid lines on the graph.
- Precision
- Both fixed decimal format and scientific notation display numbers to the right of the decimal point. The accuracy of each format can be adjusted by entering a value in the Precision text field or using the buttons to select a number. Precision specifies the number of digits displayed to the right of the decimal point.
- Tic Format
- Axis values can be displayed using one of three formats. Use the Tic
Format drop-down menu to select one of the following:
- Auto format
- Determines the best format for displaying axis values and truncates trailing zeros.
- Scientific
- Expresses values in exponential form.
- Fixed format
- Expresses values using a specified number of decimal places.
Shading
Use the Shading tab to change the grid attributes, the background color, and the axes length.
- Grid style
- Grid styles can be used to change the shading style of the grid. Click on a shading style button to instantly change the grid style. Options include box or line.
- Grid line color
- Select a color from the palette to instantly change the grid line and wireframe colors.
- Background color
- Select a color from the palette to change the color of the 3D
box.Note: See Preference Files for more information on specifying defaults in the preferences.mvw file.
- Axes lengths
-
- Automatic
- HyperGraph 3D automatically adjusts the display of the axes lengths to fill the graphics area.
- Manual
- Use the slider bars to adjust the relative lengths of the axes in the display. You can also add the new length value directly into the text field.