Graphical Editing of the Legend and Iso-slider
You can edit the contour, vector, or tensor plot legend in the graphics area.
Graphical Editing Mode
The values and colors of the legend can be edited in-place directly on the legend itself. Simply left-click on the value to enter the edit mode and type in the desired value.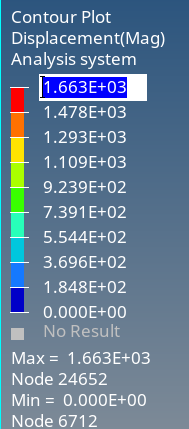
Figure 1.
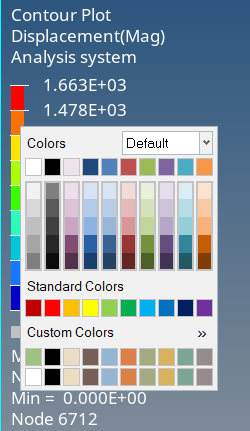
Figure 2.
Editing of values is not supported for category based legends.
- Envelope loadcase trace plots
- MaxLayer/MinLayer/ExtremeLayer plots
In addition to in-place editing, a legend context menu is also provided for quick access to various legend options. Right-click on the legend area to bring up a context menu with options to edit the type, position, numeric format, and display settings of the legend. To access additional options, click on Edit Legend in the context menu. Refer to the Legend Context Menu topic for additional details on menu options.
Iso-slider
The legend context menu also provides a convenient way to create an iso plot (based on the contour settings) and control its display from the contour legend itself without having to do so from the Iso panel. From the legend context menu, click on .- Place a slider on the left of the contour legend values.
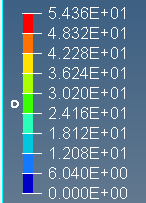
Figure 3.The slider can be dragged vertically up and down by clicking and holding the left mouse button down and moving the mouse to control the display on the screen.
- Create a label Iso followed by a Show Values mode (=,>, or <) and value in the
legend.
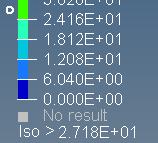
Figure 4.You can left click directly on the mode to cycle through the various options and set the desired mode.- Equal
- Updates the graphics display so that all elements with result values equal to the current iso surface level are displayed (unmasked) based on their display attributes defined on the Entity Attributes panel.
- Above
- Updates the graphics display so that all elements with result values above the current iso surface level are displayed (unmasked) based on their display attributes defined on the Entity Attributes panel.
- Below
- Updates the graphics display so that all elements with result values below the current iso surface level are displayed (unmasked) based on their display attributes defined on the Entity Attributes panel.
Left-click on the value to enter the edit mode and then type in the desired iso-value.
Additional iso settings can be accessed through Iso option in the legend context menu. Refer to Legend Context Menu topic for additional details.Note: The iso created through the legend context menu will use the contour settings to create an iso-plot. This is same as using the Use Contour Settings option in the Iso panel to create an iso-plot.After creating an iso-slider, updating the contour by changing some settings may cause a mismatch between the contour plot and the iso-plot. In such cases, the iso-slider will automatically be removed from the legend and you can then only control the iso plot through the Iso panel.