Contour
Use the Contour tool to create contour plots of a model and graphically visualize the analysis results.
From the Results toolbar, click Contour
 .
.
Note: You can also select from the Results menu.
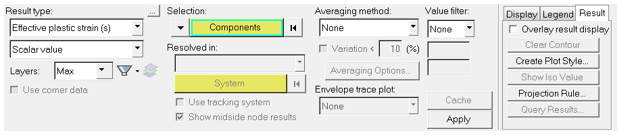
Figure 1. Contour Panel
The options in the panel will vary, depending on the type of model and results files that
are loaded:
- Select from the various options available for: result type, element layer, entity selection, resolved in (result coordinate system), show midside node results, averaging method, averaging options, and envelope trace plot.
- Select and enter value filter options.
- Set the display options for the contour plot which is automatically applied to the model.
- Enter the legend threshold options.
- Manage the result display controls.
When you are finished making all your selections, you can create a contour plot by clicking Apply in the lower middle section of the panel.
After a contour is applied, you can click Cache to add this result to an internal cache. This can be used to cache all of the results that are likely to be viewed multiple times in a given session, thereby avoiding re-computation and allowing you faster switching between scalar results. See the Caching Results topic for additional information.