Edit Category Legend
Category legends display the names for different color bands, instead of values, for easy identification of plots from a contour.
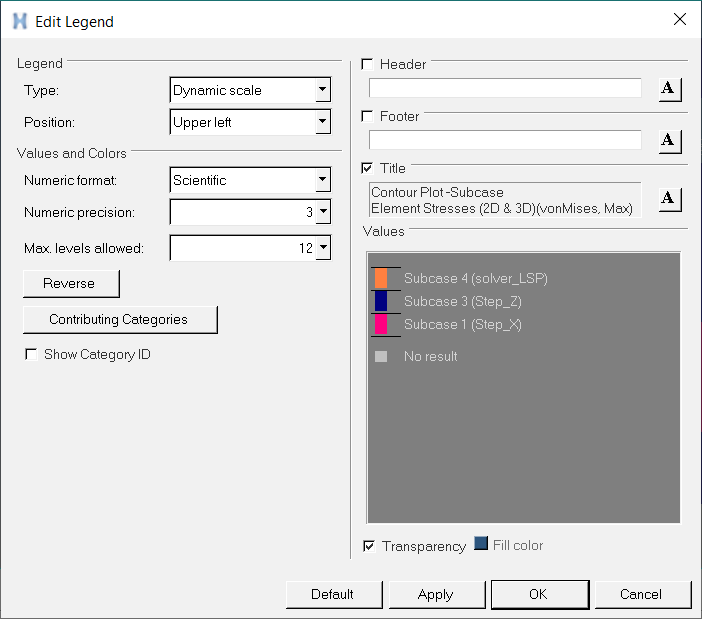
Figure 1. Edit Legend Dialog
The *UseLegacyCategoryColor Preference File Statement controls the default color scheme that will be used by category-based legends (used in case of envelope trace plot, max/min/extreme layer plots). When it is on, it will use the rainbow color scheme and category colors can not be changed. When it is off, it will use a new color scheme implemented in Altair HyperView2019 that allows category colors to be changed.
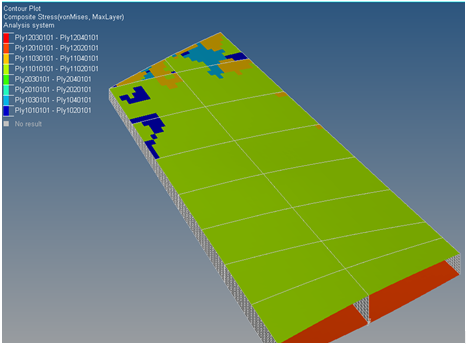
Figure 2.
| Legend | ||
| Type |
|
|
| Position | Select the position of the legend within the HyperView window (Upper left, Upper right, Lower left, or Lower right). | |
| Values and colors | ||
| Numeric format |
Note: *DefineNumericFormat() can be added in the preferences_post.mvw
file, to define the default setting for numerical presentation in the
legend. See the Preference Files topic for more information on specifying
defaults in a preference file.
|
|
| Numeric precision | You can increment the current value from 0 to 12 decimal points. This setting only affects the queried values. | |
| Max. levels allowed | The upper limit on the number of color bands which are allowed to satisfy one
color band per category. The minimum number of layer bands you can display in a
legend is 2; the maximum is 32. The default setting is 12, however you can set this value to adjust the color bands in the graphics area to provide one color band per category (to the extent feasible) as the loadcases are switched or transient results are viewed. Once the max level is exceeded and there are more contributing categories for a plot, the grouping of the categories will take place automatically. If the number of contributing categories are less than the max levels allowed for any given plot, then only the few color bands pertaining to each contributing category will be displayed. The grouping
sequence for Max levels allowed in comparison to the contributing categories is
as follows:
|
|
| Reverse | Reverses the legend values assigned to the contour bands. | |
| Contributing Categories | Displays the Category dialog which lists of all of the categories that are
currently contributing to the selected contour. 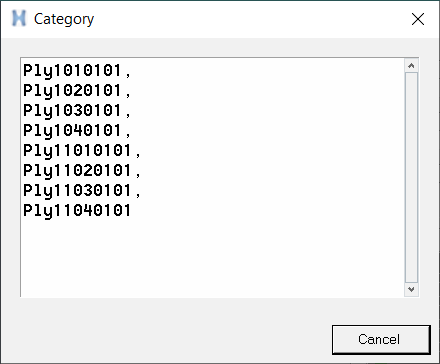 Figure 3. In the cases of a MinLayer, MaxLayer, or ExtremeLayer plot, all of the contributing layers/plies names are displayed. This is helpful in identifying all of the layers/plies when category grouping occurs (due to a lesser number of color bands than the contributing plies). |
|
| Show Category ID | Displays the category ID instead of the label. This option is available for envelope trace plots. | |
| Header | Displays the legend header. To remove the header,
deactivate the check box. To enter a new header, highlight the existing text, type
in a new header and click Apply. Click the font button,
|
|
| Footer |
Displays the legend footer. To remove the footer, deactivate the check box. To enter a new footer, highlight the existing text, type in a new header and click Apply. Click the font button, |
|
| Title | Displays the title of the legend. The title reflects
the settings used to generate the contour and cannot be changed. Click the font
button, |
|
| Values | The ability to specify user-defined values is not supported in the Category version of the dialog as the category names are decided based on the data types plotted. However, changing the legend colors (using the color palette) is available from HyperView v2019 onward. In case of MaxLayer/MinLayer/ExtremeLayer, the contributing layer or ply names are automatically shown next to the color bands. The grouping of the categories for each color band happens when the contributing categories are more than the Max. levels allowed value (set above). | |
| Transparency | Displays the legend with a transparent background. Deselect the option to display the legend with the background color which is currently displayed in the color box (located to the right of the Transparency option). | |
| Fill color | Displays the legend with a color background (if the Transparency option is deselected). To select a color for the legend background: click the color box to display the color palette, select a color, and click OK. | |
|
Note: The legend is displayed on the right side of the dialog, allowing you to
preview changes as you make them.
|
||
| Default | Resets the default legend properties. | |
| Apply | Applies the changes made to the legend. | |
| OK | Applies the changes and exits the Edit Legend dialog. | |
| Cancel | Disregards the changes and exits the dialog. | |