psd5
Modified power spectral density function.
Syntax
psd5(time, amplitude, block, overlap)
Argument
- time
- The vector of times at which the signal is sampled.
- amplitude
- The vector of signal amplitudes on which the PSD is to be performed.
- block
- Block length for spectral averaging.
- overlap
- Samples of overlap from block to block. The overlap, an integer value, must be smaller than the block size.
Example
| Curve Math Vectors | Results |
|---|---|
p1w1c1.x = (0:255:1)/512 |
The vector of sample times. |
p1w1c1.y = 6
                                            +
|
The vector of signal amplitude samples. |
x =
freq(p1w1c1.x[0:numpts(y)-1:1])/2 |
The vector of frequencies. |
y = psd5(p1w1c1.x, p1w1c1.y, 128,
64) |
The vector of PSD values. |
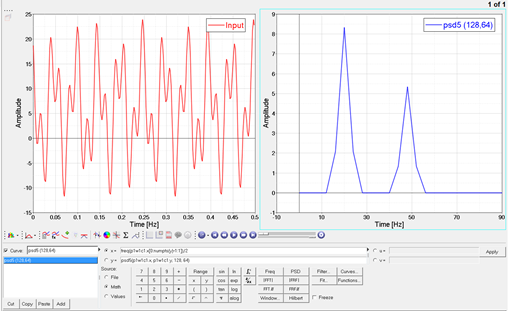
Figure 1.
Comments
The modified PSD function applies a Hanning window to each block of the PSD. The result is the average PSD per block.
The Hanning function compensates for the bias that it induces by removing the DC component and scaling the data in each block prior to performing an FFT.
The PSD contribution of the sinusoidal components at 20 and 48 hertz are 25 and 16, respectively. See the psd help topic for details on those calculations.
The Hann window spreads each PSD contribution over 3 bins, with 2/3 of the power in the middle bin, and 1/6 in each of the side bins. The output resolution is 4Hz, so the output values are as follows for the 2 block example:
PSD(16) = 1/2 * 1/6 * 25 = 2.0833
PSD(20) = 1/2 * 2/3 * 25 = 8.3333
PSD(24) = 1/2 * 1/6 * 25 = 2.0833
PSD(44) = 1/2 * 1/6 * 16 = 1.3333
PSD(48) = 1/2 * 2/3 * 16 = 5.3333
PSD(52) = 1/2 * 1/6 * 16 = 1.3333