*Symbol()
Defines the style, color, and spacing for symbols on a curve.
Syntax
*Symbol (Style, Color, Every, Scale)
Application
HyperGraph
Inputs
- Style
- An integer between 0 and 9 specifying the symbol to display on the curve.
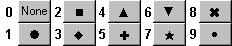
Figure 1. - Color
- An integer between 0 to 63 representing any of the 64 colors on the palette.
- Every
- The frequency of symbol placement on the curve.
- Scale
- Scales the size of the symbol. For example, a value of "2" doubles the diameter of the
symbol.Note: This can only be set through the Plot Browser entity editor.
Context
*BeginCurve()
Report Definitions
Example
*BeginCurve(On, "Resultant Force (N)")
	*Line(1, 2, 1)
	*Symbol(1, 2, 10)
	*BeginVector(X, File)
		*Filename("../../demos/plotting/FORCES")
		*DataType("Force")
		*Request("abd.force trans")
		*Component("Resultant Force (N)")
		*ScaleFactor(1)
		*Offset(0)
	*EndVector()
	• • •
*EndCurve()
Comments
Palette colors are numbered from left to right, top to bottom beginning with 0 in the Curve Attributes panel.
If Every is 10, symbols are placed on every 10th point, starting with the 1st point. In other words, if Every is 10, then points 1, 11, 21, 31, etc., have a symbol.