Flexible Reports
Automate the generation and presentation of standard animations, plots, and tables. Add or overlay predefined page sets to the current session.
The content and layout of a report is defined by a report definition. A report definition specifies how to post-process result information for a particular test or analysis data file. Report definitions typically consist of a series of pages containing HyperView, HyperGraph, and TextView windows.
Use flexible reports to easily compare test and simulation data. Channel Mapping is available, which reconciles mismatched channels (Type, Request, and Component data). Save the reconnected channels to a configuration file and use this file later. From the dialog, directly edit parameter attributes for parameters created with the Parameters Browser.
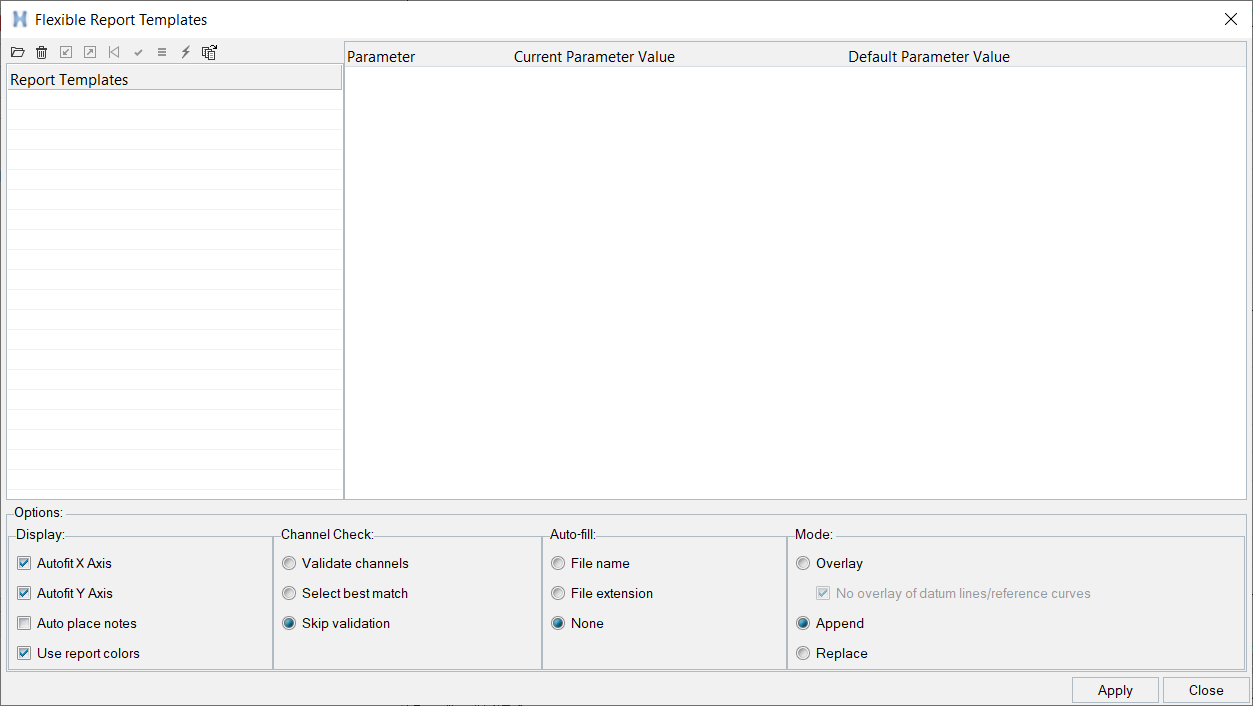
Figure 1. Flexible Report Templates dialog
- Parameter
- The parameters included in the currently selected report template.
- Current Parameter Value
- The value of the corresponding parameter in the Parameter column. You can select the parameter to edit it directly.
- Default Parameter Value
- The default values for each parameter listed in the dialog. It is a
non-editable field. By default, this column is hidden. Press the arrow,
 , to display the column.
Click Apply to append, replace, or overlay new pages. When using Overlay and Replace in situations where multiple applications of the same report exist, the application prompts you to select the correct report to overlay or replace.
Add a Report Template
-
From the Report toolbar, click the Open Reports panel
icon,
 .
.
Delete a Report Template
-
From the Report toolbar, click the Open Reports panel
icon, .
Display
- Autofit X Axis/Autofix Y Axis
- Locks the x or y axis of the current plot so that it does not change as new plots are overlaid.
- Auto place notes
- Automatically fits any notes you add to the window.
- Use report colors
- When selected, line colors, line styles, symbol colors, and symbol styles are applied based on the report template. When the Use report colors checkbox is deselected, curve lines and symbols are colored based on the default colors specified in the preferences file. In both cases, the report template controls the display of curve lines and symbols.
Channel Check
Validate Channels
Use Channel Check to add flexibility to HyperGraph by reconciling reports with mismatched channels.
After loading and selecting a report template from the Report Templates list, select one of the following Channel Check options from the Flexible Report Templates dialog, and click Apply.
- Validate Channels
- The Channel Mapping dialog is displayed if there is a mismatch among
type/request/components. From the Flexible Report Templates
dialog, you can also click the check mark,
 , to display the Channel Mapping
dialog.
, to display the Channel Mapping
dialog. - HyperGraph checks the subcase type, data
type, request, and component values between the files and displays the
matched and unmatched channels in the dialog. All channels referring to
a file can be skipped, and you can check and reconnect their types,
requests, and components if there is a mismatch. If there is an
unmatched channel and you select a component from one of the drop-down
menus (Subcase Type, Data Type, Request, or Component) to correct it,
HyperGraph automatically fixes the other
mismatched components. Mismatched channels are displayed with a red x
next to them,
 . A green check mark,
  ,
indicates a match.
,
indicates a match. -
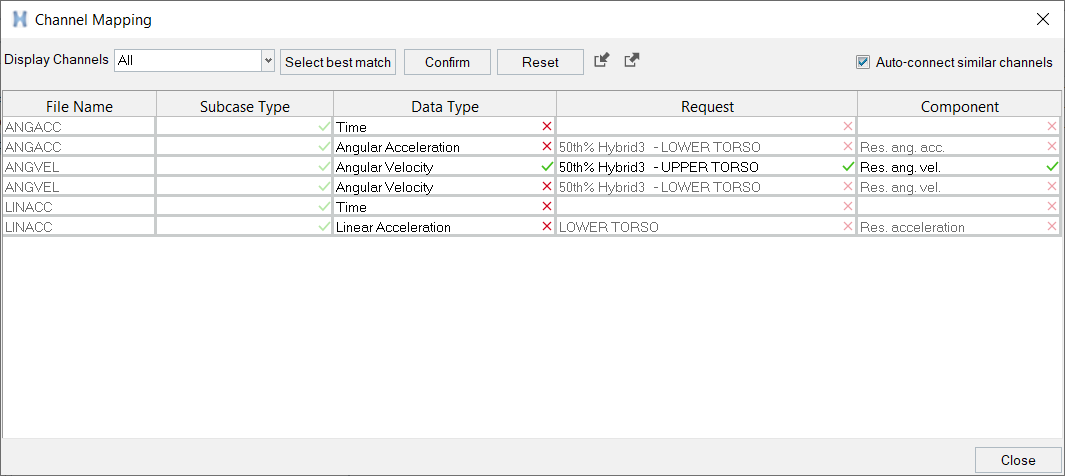
Figure 2. Channel Mapping dialog with unmatched channels -
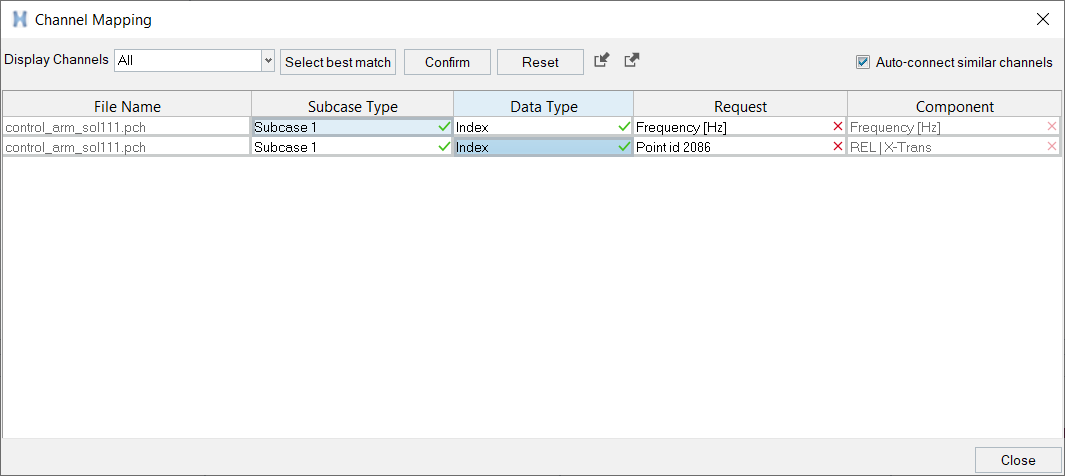
Figure 3. Channel Mapping dialog with mismatched channels -
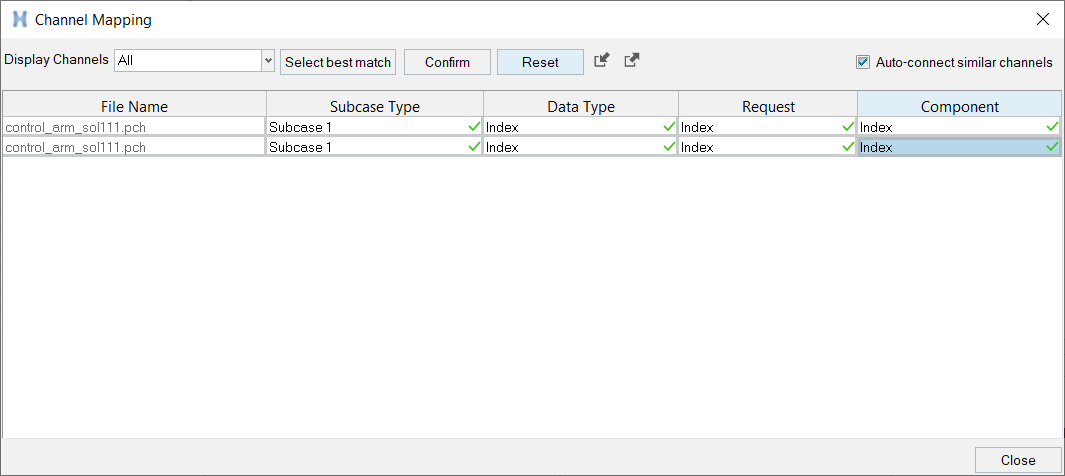
Figure 4. Channel Mapping dialog with matched channels - Select Best Match
- The Channel Mapping dialog is not displayed. Instead, a best-match
algorithm runs in background to match the type/request/components if
there is a mismatch. You can also perform this operation using Select
Best Match icon,
 , from the Flexible
Reports Templates
dialog.
, from the Flexible
Reports Templates
dialog. - Skip Validation
- The Channel Mapping dialog is not displayed, nor does it use the best match algorithm in background to match the type./request/components if there is a mismatch; it plots the signals as-is.
Filter and Sort Data Lists
The Channel Mapping dialog contains filtering and sorting functionality to facilitate matching the Subcase Type, Data Type, Request, and Component channels, along with other display and filtering options related to the lists that are displayed in the fields. Wild card support is not available.
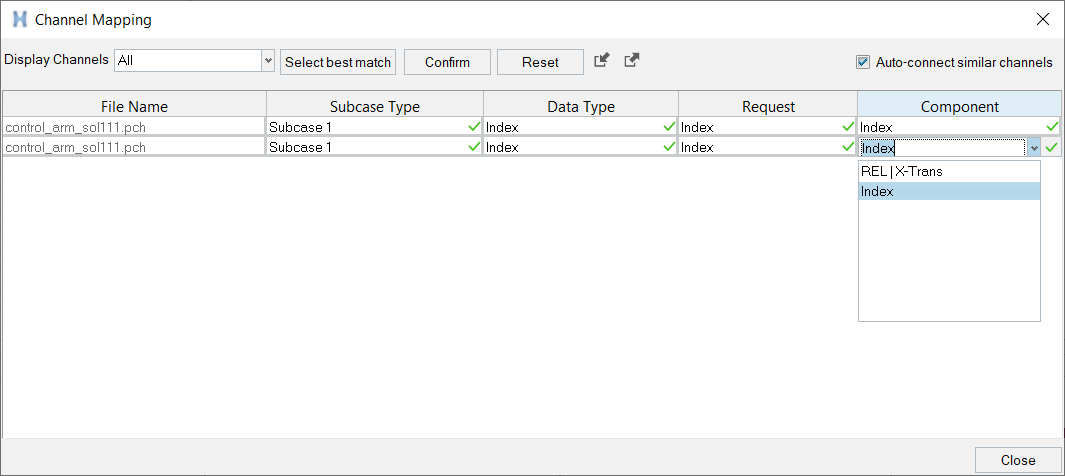
Figure 5.
- Display Channels
- All displays all channels.
- Select Best Match
- Inserts the best matches into the selected fields, according to the
matching algorithm. The results are sorted using a string match to the
shortest distance. The icon to the right of the field changes from this,
, to a yellow star,
 , upon selecting this option.
 - Confirm
- Click Confirm to approve the current best match
selections. The icon displayed in the the selected fields is updated
from this, , to this, .
- Reset
- Resets the fields to the default, or previous, selections. The and
icons return to the .
- Auto-connect similar channels
- This option is on by default. If you want to manually correct one or
more channels without similar channels updating automatically, deselect
the Auto-connect similar channels option.Note: If you reselect Auto-connect similar channels before saving your selections to a config file, and you attempt to a match a channel, all similar channels are mapped, and your previous selections are overridden.
Context Menu and Configuration File
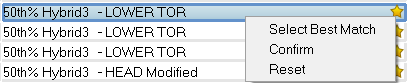
Figure 6.
Once the channel mappings are resolved, click Save Config File to save the reconnected channels to configuration file which can be used for future mappings.
Click the File Browser icon in the Open Config File field to load a previously saved configuration file to correct any unmatched channels. Once loaded, click Apply on the main panel to plot your results.
Sort Node IDs
You can sort a large number of node IDs in the Channel Mapping dialog.
Auto-fill
Autofill
- File name
- Autofills the directory. Other files needed for the report template are updated to use the files in the selected directory based on the file name.
- File extension
- Autofills the directory. Other files needed for the report template are updated to use the files in the selected directory based on the file extension.
- None
- Disables autofill. Select the required file set for each parameter.
Use Autofill Directory
-
From the Report toolbar, click the Open Reports panel
icon, .
-
To autofill the remaining files in the Reports panel, right-click the file path
next to PLOT_FILE_1 and select Autofill directory.
By selecting Autofill directory, the other files needed for the report template are updated to use the files in the selected directory.
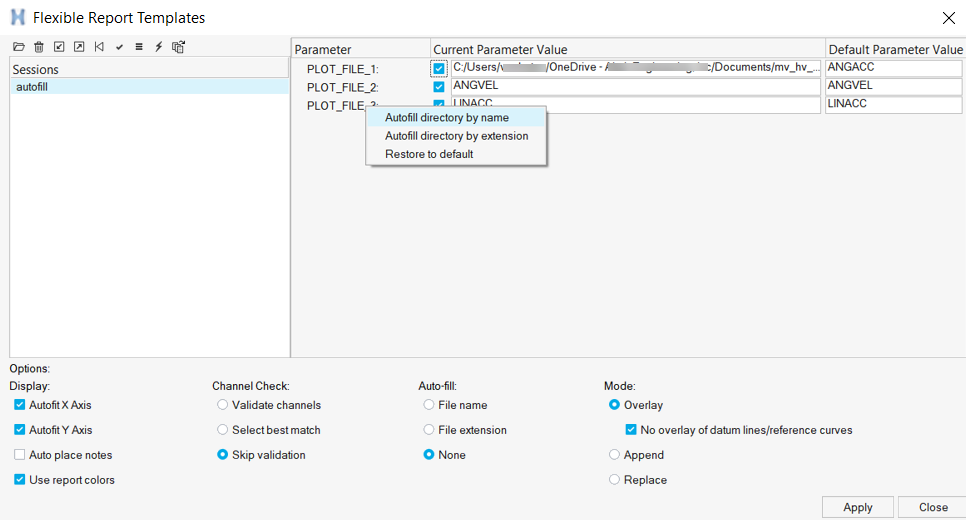
Figure 7. Autofill option
Mode
- Overlay
- Overlay mode combines report animations and plots for comparison in the session. Report definitions with different names can be overlaid if they have the same layout, which means the same number of pages, where each page has the same page layout and the same number of applications per window. If the report layout does not match, the report is added to the end of the session.
- Append
- Adds a report to the end of the current report.
- Replace
- Replaces an existing report with a new report. Report definition names must match. If report definition names do not match, the report is added to the end of the session.
Layers
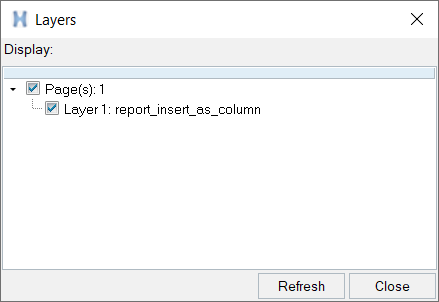
Figure 8.
- Refresh
- If you delete a curve or make other changes within the Flexible Report Templates dialog, such as adding another layer, click Refresh to reflect those changes inside the Layers dialog.
- Rename
- From the Layers dialog context menu, click Rename to rename the selected layer.
- Delete
- From the Layers dialog context menu, click Delete to
delete the selected layer.Note: Curves associated with the layer will be deleted in HyperGraph; models in HyperView or cells in TableView will not be deleted.
If you overlay two report templates, you will lose all the "saved" parameters.
By creating multiple report definitions, you can quickly post-process result information from various test and analysis sources. Report definitions can be interactively added to a session by adding separate report definition files. Report definitions can be placed directly in a session file or registered in your preference file so they are automatically loaded at startup. Report definitions added from the preferences file are not saved to the session file.
Use Cases for HyperView Multiple Result Files
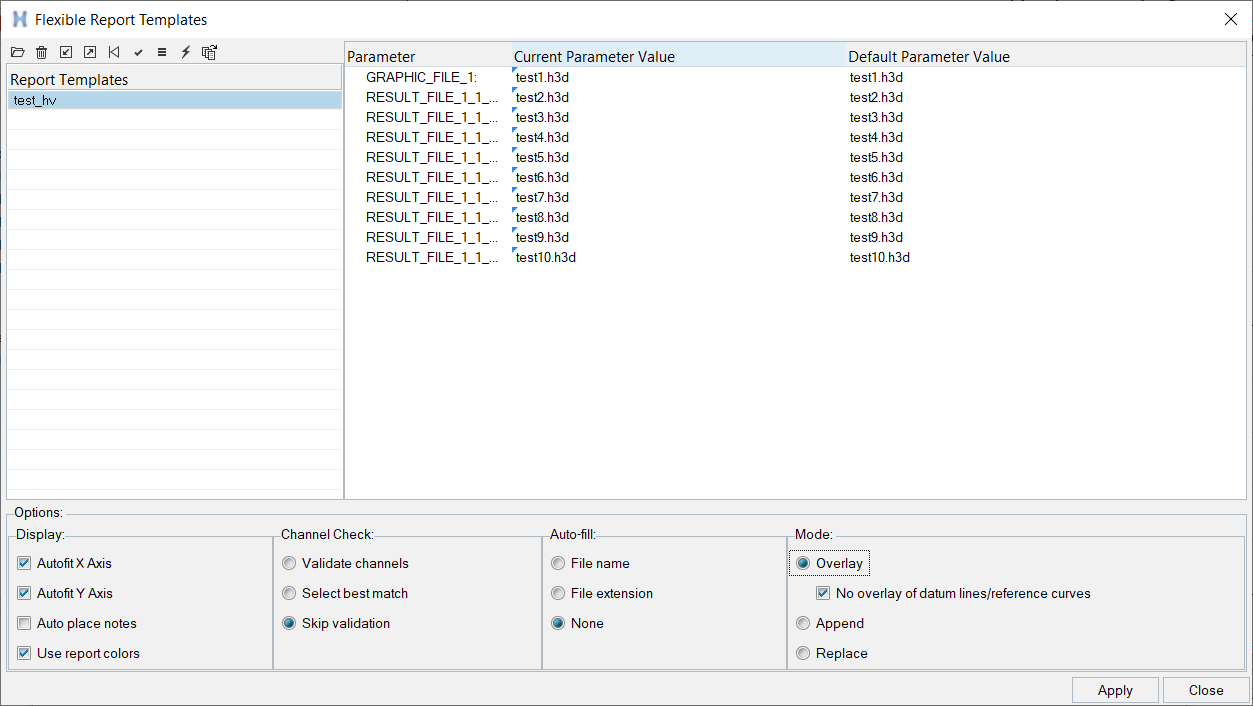
Figure 9.
The model file and result files are saved as Parameters in the template with a special syntax used for the result files.
The parameter name for the Result file is: RESULT_FILE_<PAGE#>_<WINDOW#>_<MODEL#>_<FILE#>
This naming convention properly identifies the result files belonging to a particular page/window/model. You can then choose to replace only that specific set of files without affecting other files.
- Select a particular file parameter and replace it with a different file.
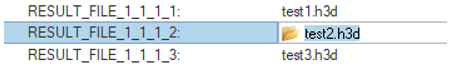
Figure 10. - Select several or all result files and replace them with a different set of
files. This can be done by clicking the Add Multiple Result
files icon from the Flexible Report Templates dialog. The
Result File List dialog is displayed, which lists
all result files (RESULT_FILE_) in the report template.
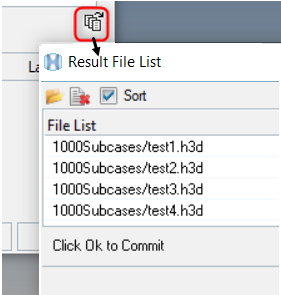
Figure 11.From this dialog, you can select all files or a subset of files. Click the file browser icon to select a different set of files to replace. The Sort check box is enabled by default, which means that the files picked as replacements are always sorted in alphabetical order first before replacing. If the Sort check box is deselected, then the files are used in the order the operating system selects them.
Note: On Linux, the sort option is always enabled so the check box is grayed out.Note: If the number of files picked to replace (M) is greater than the selected (N) files, then any extra files are ignored. Conversely, if the number of files picked (M) is fewer than the selected (N) files, then only the first M files will be replaced.