line
Add a curve in current axes or a specified axes.
Syntax
h = line(x, y)
h = line(x, y, z)
h = line(..., property, value, ...)
h = line(hAxes, ...)
Inputs
- x, y, z
- Range of the x, y, and z axes.
- property
- Properties that control the appearance or behavior of the graphics object.
- value
- Value of the properties.
- hAxes
- Axis handle.
Outputs
- h
- Handle of the line graphics object.
Examples
Simple line
example:
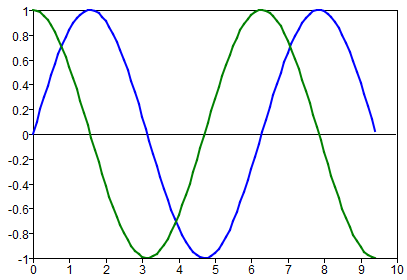
clf;
x=[0:0.1:3*pi];
plot(x, sin(x));
line(x, cos(x));
Simple plot example with
format:
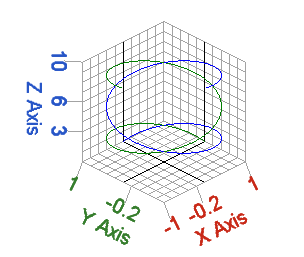
clf;
t=[0:0.1:3*pi];
x=sin(t);
y=cos(t);
z=t;
plot3(x,y,z);
line(y,x, z)
Comments
If the first argument of plot() is an axes handle, lines will be created in that axes:
h = plot(hAxes, ...)