title
Sets the title of the plot.
Syntax
h = title(str)
h = title(hAxes, str)
h = title(..., property, value, ...)
Inputs
- str
- Text to be set as title.
- hAxes
- Axis handle.
- property
- Properties that control the appearance or behavior of the graphics object.
- value
- Value of the properties.
Outputs
- h
- Handle of the title graphics object.
Examples
Simple title
example:
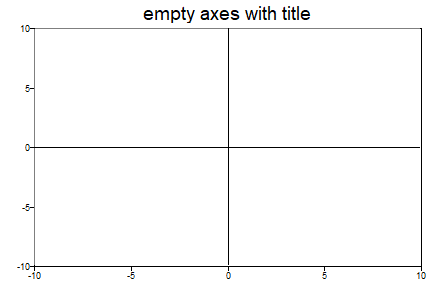
Figure 1. Simple title example
clf;
h = title('empty axes with title');
Figure 1. Simple title example
Cell input title
example:
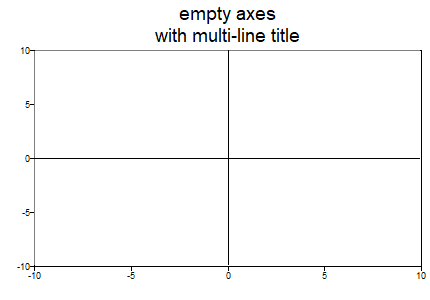
Figure 2. Cell input title example
clf;
h = title({'empty axes', 'with multi-line title'});
Figure 2. Cell input title example
Optional arguments
example:
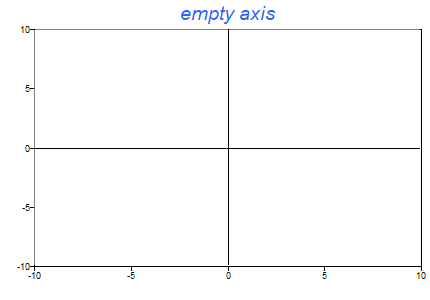
Figure 3. Optional arguments in title command
clf;
h = title('empty axis', 'color', [50 100 250], 'fontangle', 'italic');
Figure 3. Optional arguments in title command