ylim
Set and query range of y axis.
Syntax
ylim()
ylim([Y_lo Y_hi])
ylim(hAxis, ...])
Inputs
- Y_lo, Y_hi
- Lowest and highest y ranges.
- hAxes
- Axis handle.
Example
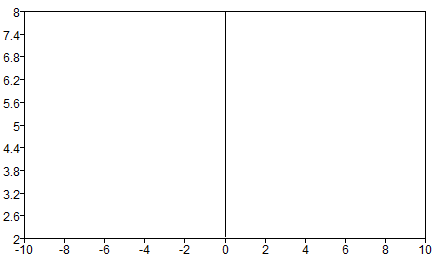
Simple ylim example:
clf;
ylim([2 8])
ylim()
ans = [Matrix] 1 x 2
2 8
Discover new features and enhancements.
New to Activate? Learn the basics here.
Start using Activate with our interactive tutorials.
Learn about the features and functionality available in Activate.
Explore the Extended Definitions, OML Guides, Block Library, API Guide and Glossary.
PDF file with in-depth information on key topics in the User's Guide.
OpenMatrix is a mathematical scripting language.
The Reference Guide contains documentation for all functions supported in the OpenMatrix language.
Creates stacked areas in an axes and returns handles of the areas.
Create autumn colormap.
Create a new axes or set current axes by passing a handle argument.
Sets the scaling and range of x, y, and z axes (x by default). Called without arguments, axis turns autoscaling on.
Creates bars in an axis and returns handles of the bars.
Creates 3d bars on an axis and returns the handles of the bars.
Create bone colormap.
Turn on/off the border of a 2D plot.
Create cividis colormap.
Clears the current axes or axes specified by handle.
Clears the current figure or figure specified by handle.
Close the current, or a specific, or all figure window.
Turns the axes colorbar on/off. Get and set the colorbar's minimum and maximum values.
Gets or sets the colormap of a figure or axes.
Creates a 2D contoured surface in an axes.
Creates 3D contoured surface in an axes.
Create cool colormap.
Create copper colormap.
Creates a copy of the style properties of a plot object.
Create cubehelix colormap.
Deletes the file(s), f, or a graphic object, h.
Docks a floating figure in the main window.
Forces an update of the current axes.
Creates an elliptical shape on the figure.
Creates a surface and a set of 3D lines defined by the x, y, and z matrices.
Creates a new figure for plotting and uicontrols.
Creates 2D filled in polygons of range x and y and color c.
Finds all objects which have a property named propertyName and the value for such property is propertyValue.
Create flag colormap.
Returns a handle to the current axes object.
Get current figure returns a handle to the current figure.
Returns the value of the named property p from the graphics handle, h. If property name is omitted, all properties of h will be returned.
Captures an image of a figure.
Returns the mouse position in the figure area.
Records the mouse position(s)/keyboard input(s) in the current figure.
Properties for the graphics object in OML.
Create gray colormap.
Turn on/off grid lines in a plot. Toggle the states if no argument is used.
Gets or sets user defined data in the GUI.
Creates a histogram in an axis.
Turn on/off the "hold" state of axes. When the "hold" state is on, new plotting data will be added to the axes.
Create hot colormap.
Create hsv colormap.
Display a matrix as an image with scaled colors.
Displays an image file in a figure.
Create inferno colormap.
Returns true if x is an axis handle; returns false if otherwise.
Returns true if x is a figure graphics handle; returns false if otherwise.
Returns true if x is a graphics handle; returns false if otherwise.
Returns true if the next plot will be added to the current one; returns false if otherwise.
Create jet colormap.
Update axes' legend text, turn on/off the legend of axes. Toggle the states if no argument is used.
Add a curve in current axes or a specified axes.
Create lines colormap.
Plots a given dataset in 2D axes with logarithmic scales for x and y axes.
Create magma colormap.
Creates mesh in an axes and returns handles of the mesh.
Construct a grid of points from coordinate vectors.
Captures an image of a figure.
Create ocean colormap.
Restore a figure from a .fig file.
Sets the style properties to a plot object.
Creates 2D or 3D patches in an axis.
Display a matrix as a heat map. The values of input matrix z are mapped to the colors of the colormap.
Create pink colormap.
Create plasma colormap.
Plots a given dataset in 2D axes.
Creates 3D lines in an axes and returns handles of the lines.
Plots given datasets in independent y-axes and a common x-axis.
Creates a line plot in polar coordinates.
Create prism colormap.
Creates a 2D quiver plot in an axis.
Properties for the graphics object in OML.
Create rainbow colormap.
Creates a rectangular shape on a figure.
Save a figure to a specific file.
Save a figure to a .fig file.
Creates dots in an axes and returns handles of the dots.
Creates 3D dots in an axes and returns handles of the dots.
Plots a given dataset in 2D axes with logarithmic scales for x axis.
Plots a given dataset in 2D axes with logarithmic scales for y axis.
Sets property values for graphics handles.
Create spring colormap.
Creates a stem plot in an axis and returns the stem handles.
Creates a 3D stem plot in an axis and returns the stem handle.
Sets up a plot grid with rows by cols subwindows and sets the current axes for plotting to the location given by index.
Create summer colormap.
Creates surfaces in an axes and returns handles of the surfaces.
Creates a textbox at coordinate x,y with text 't'.
Sets the title of the plot.
Create twilight colormap.
Creates a button group in a figure to group radio buttons.
Creates a context menu which is displayed with a right-mouse click for a figure, uitab, or select uicontrol objects.
Creates a menu item in a context menu which is displayed with a right-mouse click for a figure, uitab, or select uicontrol objects.
Creates interactive graphical control objects in a figure. Use the 'style' property of uicontrol to create different types of control objects.
Creates a menu bar for a figure.
Creates a menu item, in a menu bar, for a figure.
Creates a frame for interactive graphical control objects in a figure.
Resumes execution of code, stopping uiwait on the given handle, handle, or stopping all uiwait commands in the current session.
Creates a tab in a tabbed frame for interactive graphical control objects in a figure.
Creates a tabbed frame for interactive graphical control objects in a figure.
Creates a table in a figure.
Creates a hierarchy in the graphical user interface.
Creates a node in a uitree hierarchy.
Pauses the execution of code until the given handle, handle, is deleted, and the timeout, waittime, is reached.
Undocks a figure, making it float over the main window.
Sets the viewpoint for the current axes.
Create viridis colormap.
Creates a waitbar in the current session.
Pauses the GUI until a mouse button/key is pressed in the current window.
Creates waterfall meshes in an axes and returns handles of the meshes.
Create white colormap.
Create winter colormap.
Annotates the x-axis.
Set and query range of x axis.
Add one or more vertical lines in the current axes or a specified axes.
Annotates the y-axis.
Set and query range of y axis.
Add one or more horizontal lines in the current axes or a specified axes.
Annotates the z-axis.
Set and query range of z axis.
Describes all of the blocks in the installed Activate library.
Provides information about developing and simulating models through the Activate Application Program Interface.
Key terms associated with the software.
You've got questions? We've got answers!
Explore the Extended Definitions, OML Guides, Block Library, API Guide and Glossary.
The Reference Guide contains documentation for all functions supported in the OpenMatrix language.
Set and query range of y axis.
ylim()
ylim([Y_lo Y_hi])
ylim(hAxis, ...])
Simple ylim example:
clf;
ylim([2 8])
ylim()
ans = [Matrix] 1 x 2
2 8
(c) Altair Engineering, Inc. All rights reserved.