semilogy
Plots a given dataset in 2D axes with logarithmic scales for y axis.
Syntax
h = semilogy(y)
h = semilogy(x, y)
h = semilogy(x, y, x, y, …)
h = semilogy(x, y, fmt)
h = semilogy(…, property, value, …)
h = semilogy(hAxes, …)
Inputs
- x, y
- Range of the x and y axes..
- fmt
- Formatting string for the curve. It can be any combination for the following
strings:
- line style: '-', '-.', ':', '--".
- line color: 'r', 'g', 'b', 'c', 'y', 'm', 'w', 'b'.
- marker style: 's', 'o', 'd', 'x', 'v', '^', '+', '*', '.'.
- property
- Properties that control the appearance or behavior of the graphics object.
- value
- Value of the properties.
- hAxes
- Axis handle. .
Outputs
- h
- Handle of the line graphics object.
Example
Simple semilogy example.
semilogy(rand(1, 10));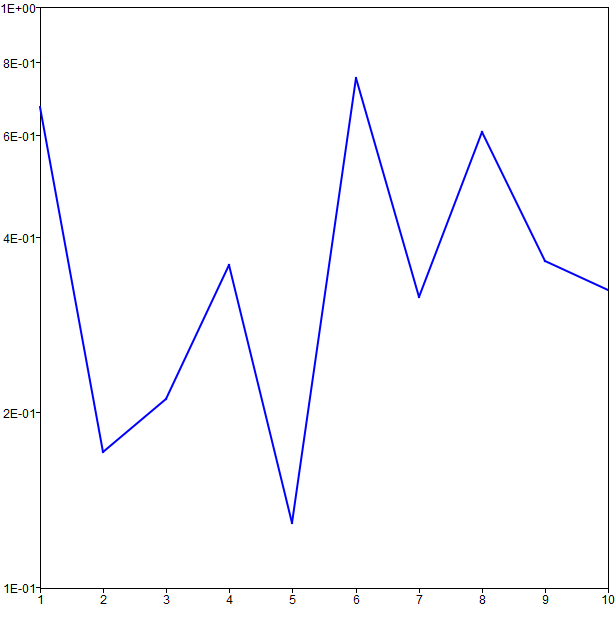
Comments
If x is omitted, the index of y is used as data to
associate with x axis. semilogy takes the optional arguments to control
the line style. It can be either a format string or property/value pair(s), or both. The
form is:
h = semilogy([x,] y [, fmt] [, property, value] …)h = semilogy(x, y, x, y, …)
h = semilogy([x,] y [, fmt] [, property, value], [x,] y [, fmt] [, property, value] …) h = semilogy(hAxes, …)