Preview Curves

Quickly review curves before plotting them in the session.

Activated from the Build Plots panel, this function is designed to work with a single file or multiple files.
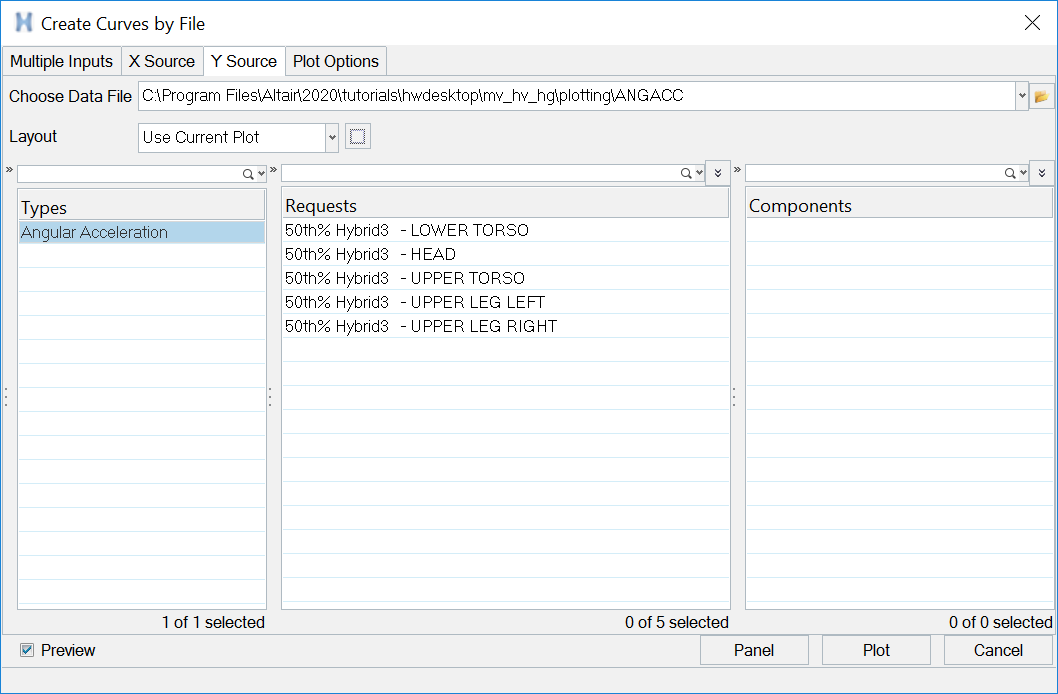


Figure 1.
When the Preview option is enabled, HyperGraph will:
  • Automatically plot the selected information in the active window when enough data is selected (type, request, component).
  • In the Legend tag, the curves are tagged as “Preview" curves. The curves will remain tagged as such until you perform one of the following actions:
    • Apply the curves in the session.
    • Change the X or Y type (thus clearing the request and component sections).
    • Deactivate the Preview checkbox.
    • Leave the panel.
  • Support the preview curves in image and animation capturing.
  • Ignore all Advanced Options settings and layout options until the curves are applied to the session.
When the Preview option is enabled, the following functionality is not available for preview curves:
  • Access through the Browser.
  • Access through the command layer.
  • Access to graphical context functionality.
  • Animation cursor.
  • Writing to session files or template files.
  • Math operations and scaling using Advanced Options.
The Preview option can be turned off by any of the following methods:
  • Deactivating the check box.
  • Clicking the Apply button.
  • Leaving the panel.
  • Selecting a different Y type with different requests and components.

Once you are finished previewing a curve(s) and click the Apply button, all selected curves are applied to the current window. The layout option and Advanced Options settings are ignored until the curves are applied to the session and the Preview checkbox is reset.

Preview a Curve from a File Using the Preview Mode

  1. From the Build Plots panel, click the Data file file browser button to load a file.
  2. Activate the Preview option.
  3. From the Subcase drop-down menu, select a subcase.
  4. From the X Type drop-down menu, select an X type.
  5. From the Y Type list, select a Y type.
  6. From the Y Request list, select a Y request.
  7. From the Y Component list, select a Y component.
    Notice when the Y component is selected, the curves are immediately plotted in the active plot window.

Plot a Preview Curve and Change the Y Component Selection(s)

  1. From the Build Plots panel, click the Data file file browser button to load a file.
  2. Plot a curve(s) in the active window.
  3. Select the Preview option.
  4. From the Subcase drop-down menu, select a subcase.
  5. From the X Type drop-down menu, select an X type.
  6. From the Y Type list, select a Y type.
  7. From the Y Request list, select a Y request.
  8. From the Y Component list, select a Y component.
  9. Select a different set of Y components.
    Notice that the plotted curves from step 2 remain, and tagged preview curves from steps 4-8 are replaced.

Plot a Preview Curve and Change the Y Request Selection(s)

  1. From the Build Plots panel, click the Data file file browser button to load a file.
  2. Plot a curve(s) in the active window.
  3. Select the Preview option.
  4. From the Subcase drop-down menu, select a subcase.
  5. From the X Type drop-down menu, select an X type.
  6. From the Y Type list, select a Y type.
  7. From the Y Request list, select a Y request.
  8. From the Y Component list, select a Y component.
  9. Select a different set of Y requests.
  10. Notice that the plotted curves from step 2 remain, and tagged preview curves from steps 4-8 are replaced.

Plot a Preview Curve and Select Different Request and Component Options for the X or Y Type

  1. From the Build Plots panel, click the Data file file browser button to load a file which contains multiple X or Y type selections, at least some of which have different request and component options.
  2. Select the Preview option.
  3. From the Subcase drop-down menu, select a subcase.
  4. From the X Type drop-down menu, select an X type.
  5. From the Y Type list, select a Y type.
  6. From the Y Request list, select a Y request.
  7. From the Y Component list, select a Y component.
  8. Select a different X or Y type which does not have the same request and component options as the initially-selected X or Y type.
    Notice that the tagged preview curves disappear, as the request and component options change.