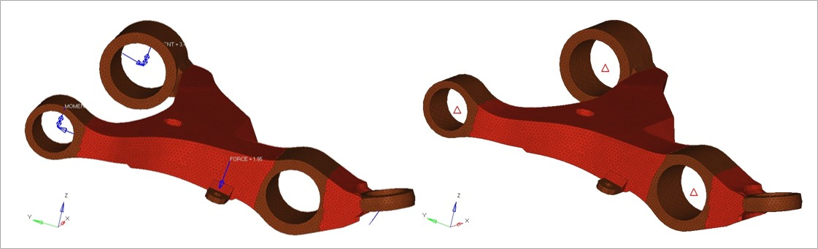
Topology optimization of control arm is solved for:
Analysis Type
Linear Static
SPC
Force and Moment
Optimization
Topology
Objective: Min Volume
Subject to: Local stress constraint
New stress responses for Topology and Free-Size optimization can be defined via the
DRESP1 Bulk Data Entry. The Stress Responses are internally aggregated
using the Stress-NORM approach to maintain the number of created responses at a reasonable
number.
The Stress-NORM method is used to approximately calculate the maximum value of the stresses
of all the elements included in a particular response. This is also scaled with the stress
bounds specified for each element. Therefore, to minimize the maximum stresses in a
particular element set, the resulting Stress NORM value is internally constrained to a value
lower than 1.0. For more information on the Stress-NORM method, refer to the
DRESP1 Bulk Data Entry in the Reference Guide.
FE Model
Elements Types
CTETRA
RB2
The linear material properties are:
MAT1
Young’s Modulus
1.6E5 MPA
Poisson's Ratio
0.25
Initial Density
7.1E-9 Mg/mm3
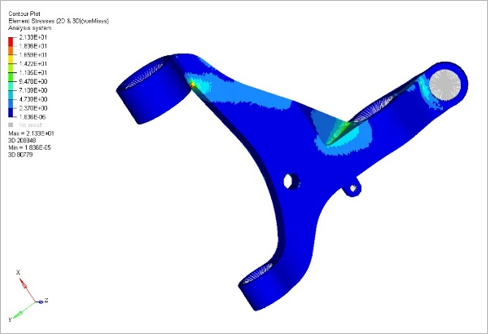
Results
Figure 2. Element Stress Plot
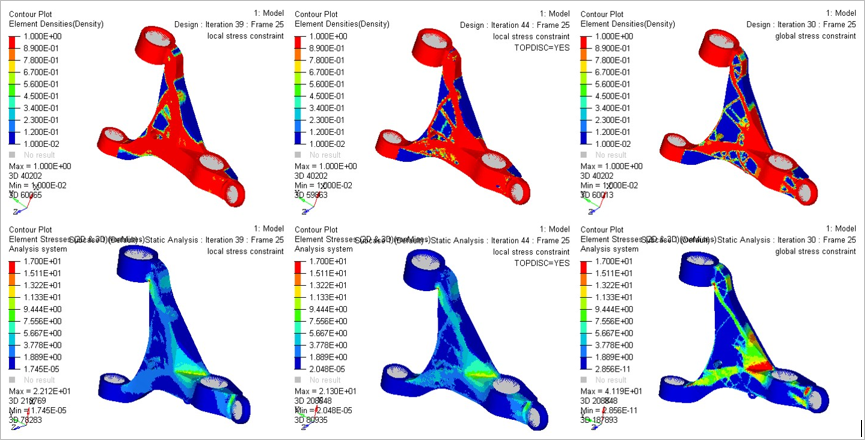
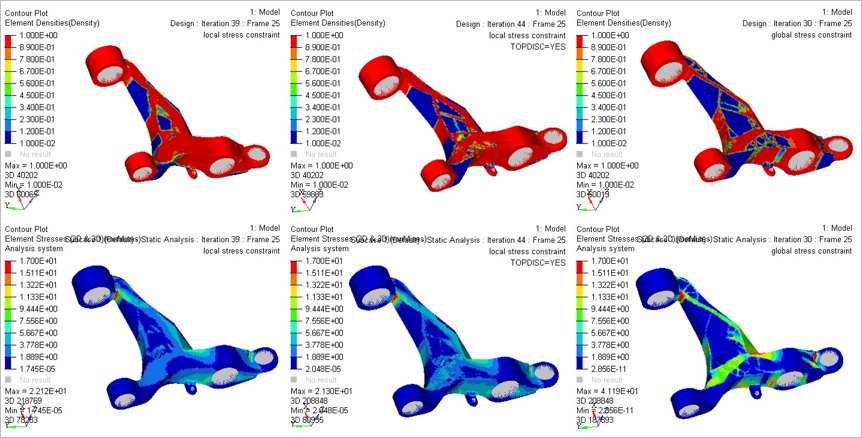
OptiStruct provides the Element density information for all of
the iterations (Figure 3 and Figure 4). In
addition, OptiStruct will also show Displacement and von Mises
stress results of a linear static analysis for iteration 0 and iteration 44 (Figure 2). Figure 3. Element Density Contour Figure 4. Element Density Contour (different view)