Instrument Panel
The Instrumental Panel tool facilitates the post-processing of the FMVSS201 and ECE-R21 analysis.
This tool uses time-history and result files as input and automates the post-processing with minimal input, therefore reducing the report generation lead time.
From the ribbon > tool group, select the Instrument Panel tool to invoke the IP Impact Post dialog.
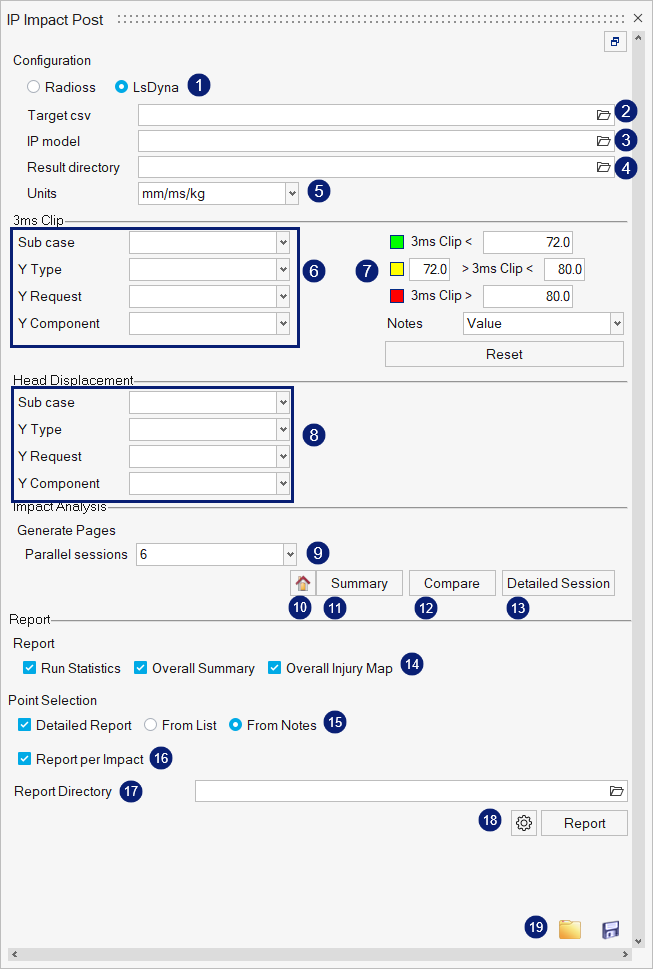
Figure 2. IP Impact Post dialog
- Configuration (Solver Selection)
Supported solvers are Radioss and LS-DYNA.
- Target csvSelect the HyperMesh-created *.csv file.Note: Upon using HyperMesh to mark and position the impactor, HyperMesh generates a CSV file
- IP model
Select the solver input file that contains the Instrumental Panel model.
- Result directory
Select the root directory that contains the analysis directories as sub-directories.
- Units
Select the model units from the drop-down menu.
- 3ms Clip
Select the acceleration data from the output file for the 3ms clip curve.
Select the sub case, Y Type, Y Request, and Y Component.
- Threshold/Limit Values and Color SelectionDefine the limit values and colors.
- Click the color palette to select the color.
- Define the limit/threshold values in the value field.
- Select the 3ms clip value or the impact location name for summary.
- Use Reset to restore the default values and colors.
- Head Displacement
Select the displacement data from the output file for the displacement versus time curve.
Select the sub case, Y Type, Y Request, and Y Component.
- Parallel sessions
Select the number of batch processes to launch. For example, if processing 200 impact locations, the number of parallel processes are launched to reduce processing time.
- Home button
Click to return to the summary page.
- SummarySelect the impact locations to post-process in the summary page:
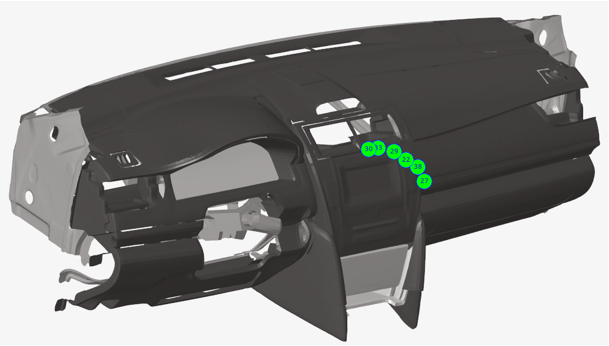
Figure 3. - CompareClick Compare to select the impact locations to be processed using the Select compare options:
- Select folder to compare: From the file browser, select multiple analysis folders to be compared.
- Select notes to compare: Select multiple notes on the summary window to be compared.
- Detailed SessionClick Detailed Session to select the impact locations to be processed through the Select target points window. For each selected target point, a page is generated with the following results:
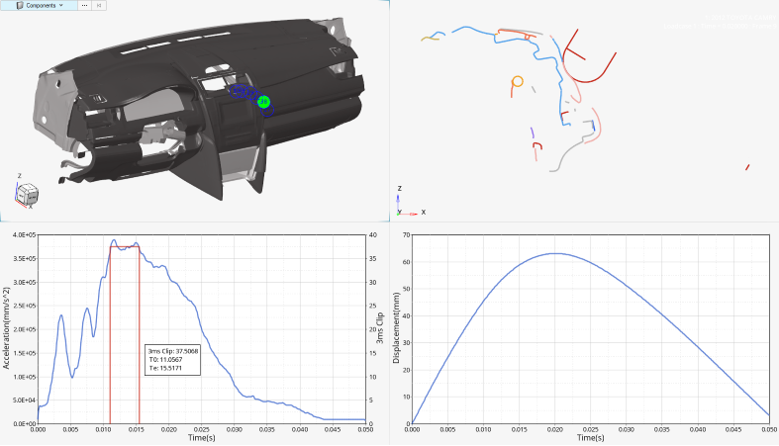
Figure 4. - ReportRun Statistics: Run a summary of the Normal versus Error termination per impact location:
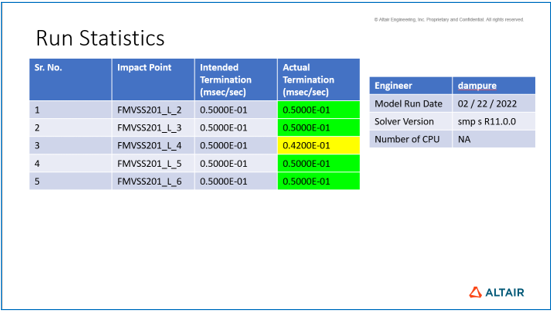
Figure 5.Overall Summary: Summary table of the 3ms clip value and maximum displacement for all selected impact locations.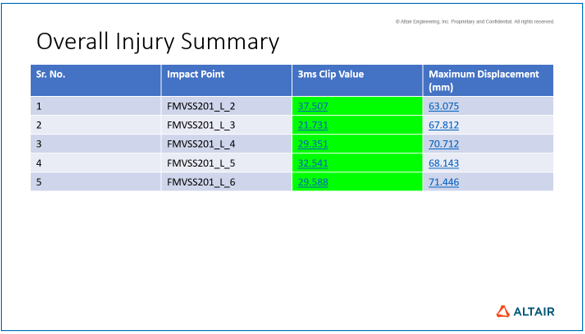
Figure 6.Overall Injury Map: 3ms map on the Instrumental Panel.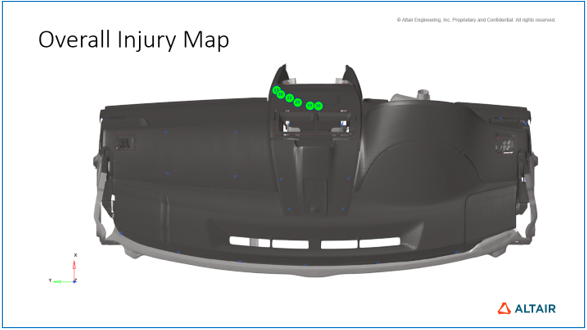
Figure 7. - Point Selection
From List: Select the impact points from the list to create the detailed report for.
From Notes: Select the impact points from the modeling window by selecting the notes to create the detailed report for.
- Report per ImpactA detailed slide for all selected impact points is created in the report.

Figure 8. - Report Directory
The report directory where the consolidated report PowerPoint file is saved.
- Report
Click Report to generate the final PowerPoint file. The Setting icon opens the report settings.
- File Browser Folder and Save
Save or import a configuration file containing all defined setups.