Stochastics/DoE Post Processing
SnRD Post Stochastics and DoE module allows the analyst to investigate hundreds of simulation results in a powerful way. When multiple variational studies have been setup, and results imported, SnRD will automatically post process all the Rattle and Squeak results for high level and deep dive investigation. You can refer to Variabilities Analysis for more information.
FEM and pre_output.csv files in
SnRD Main Tab first.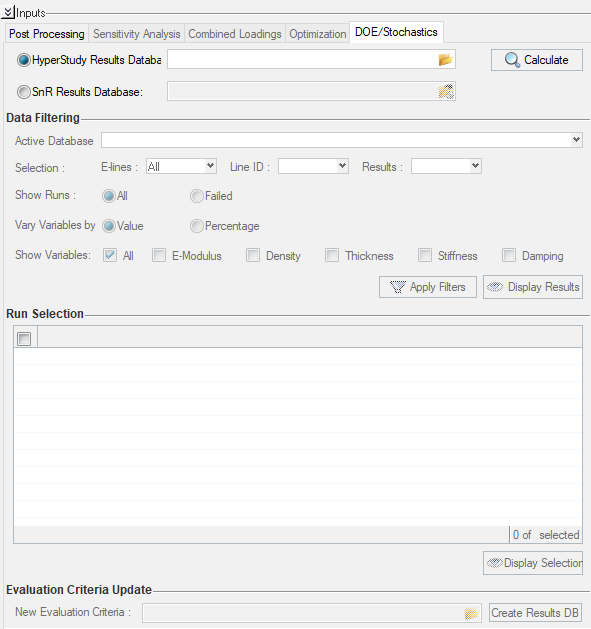
Figure 1.
- HyperStudy Results Database - file selection option to
browse and select the
XMLfile exported from Export Variations Study. - Calculate - to read the run results data in the selected
XMLNote: Once you obtain the HyperStudy XML file and evaluates the xml file in hyperstudy as mentioned earlier, you must be able to see pch files generated for each run in the folder. SNRD Post enables us to display and visualize this results. At this stage , you can load the Hyperstudy xml in the Hyperstudy xml database in and click Calculate. On click of Calculate, the necessary information of each dynamic run is mathematically calculated using Compose and a SnR database is generated in the same folder. You can re-use this SnR database xml for further processing and save recalculation time.
- SnR Results Database - file selection option to browse
and select the results database
XMLcreated from SnRD Stochastics post processing.Note: This feature is useful when you have already run a stochastics session and wants to re-use it.Data Filtering
- Active Database - to select the database for the post processing
- Selection - to make selections for the following options
-
- E-Lines - to choose the ELines types
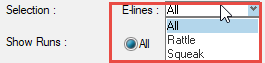
Figure 2.- All
- Rattle
- Squeak
- Line ID - to choose the required ELine ID.All Elines will be listed.
- Results - to select the result type -
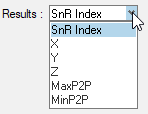
- SnR Index - an Unit less criteria that describes Squeak
or Rattle occurrence.
- In the case of Rattle - Relative Displacement in Z
higher than the
Gap - Tolerance - In the case of Squeak -
Max P2Phigher than the Impulse Rate inverse.
- In the case of Rattle - Relative Displacement in Z
higher than the
- X
- Y
- Z
- MaxP2P
- MinP2P
- SnR Index - an Unit less criteria that describes Squeak
or Rattle occurrence.
- E-Lines - to choose the ELines types
- Show Runs - radio button option to display runs for All or Failed
- Vary Variables by - to apply variation values for -
- Percentage - percentage of variation from the nominal value
- Value - actual value used in the Run
- Show Variables - to select the runs for the parameters
used for conducting the variations studies.
- All - will filter and display all the variations
- E-Modules - will filter and display only Youngs Modulus study
- Density - will filter and display only Density study
- Thickness - will filter and display only Thickness study
- Stiffness - will filter and display only Stiffness study
- Damping - will filter and display only Damping study
- After selecting the required filters, click Apply
Filters. This will filter the run details and list the results in
the below table.Note: To perform this, you will have to manually copy the
summary.datafile fromrptfolder toapproaches > stofolder. - Display Results - this will filter the run details and
plot the results for the same.
Run Selection
- After filtering the results, runs will be listed in the table. Select the required run from the table using the checkbox against the run.
- Display Selection - to display the plots for the selected
runs from the table.
Evaluation Criteria Update -
Regeneration of a new Database XML for all Stochastic Runs for a different GD&T/Impulse Rate data file. You select a new csv file and clicks Create Results DB. This new data base is loaded in the session and added to “Active Database”
- Select a new DTS file using the file selection option.