Custom Module Creation Process
Create and plug-in custom modules to Report.
- The .tcl script that runs the functionality of the module.
- .xml script that populates in the property area in the user interface
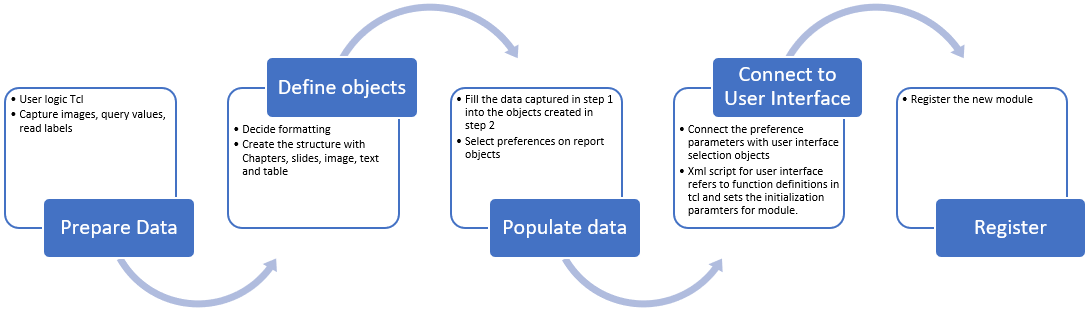
Figure 1. Module Creation Workflow
For any module to work successfully, the .tcl and .xml files need to be connected and contribute their individual responsibilities properly.
For this process overview, two files will be used: CurveMaxima.xml and CurveMaxima.tcl. They are located here: <installation_directory>/tutorials/hwdesktop/mv_hv_hg/publish_reports/CurveMaxima.xml and <installation_directory>/tutorials/hwdesktop/mv_hv_hg/publish_reports/CurveMaxima.tcl
Module Creation Process Overview
- Data preparation.
The custom script performs the necessary processes on the model or graphs and prepares it for data capture. Values and information are captured, which can be used later for Report titles, image captions, and to populate text fields and tables.
- Defining the objects and placeholders.
The Report API layer is used to create slides based on slide layouts or Document chapters. These objects contain images, text, and tables.
- Populate data.
The data prepared in step 1 is used to populate objects in step 2. The property selection for individual items is set during the item creation (step 2) or this data population step.
- Connect to the user interface.Decide the input parameters that will be required to run this module. Options include:
- Where the data exists (page and window selection, single or multiple).
- The format to present the data. For example, specific slide layout styles.
- The amount of content to add. For example, a module could have two modes: short and descriptive.
- Register the module.
Register the directory of the module scripts in one of the recommended ways.
For this example, the custom module Curve Maxima will be used. This file can be found in <installation_directory>/tutorials/hwdesktop/mv_hv_hg/publish_reports/CurveMaxima.xml
- Module Objective
- From a given HyperGraph window, identify the names and IDs of all curves, the maximum Y value, and the curve's X location in a tabular format. Capture an image that highlights the maximum points from all curves. This needs to flexible for any Document or Presentation format.
Data Preparation
A set of lines (tcl) that prepares the data is required. For this module's objective, the HyperGraph window needs to be defined to get a clean capture. This includes all curves visible and only the maximum value notes created. Also, the values of the maximum Y and its equivalent X need to be found for each curve ID and label.
The CurveMaxima.tcl file can be found in <installation_directory>/tutorials/hwdesktop/mv_hv_hg/publish_reports/CurveMaxima.tcl
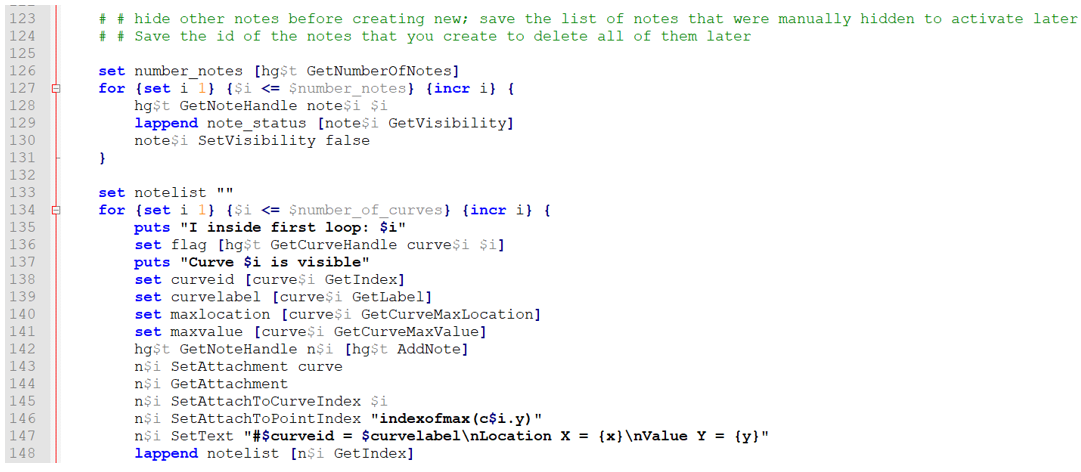
Figure 2. Data Preparation
Define Objects and Placeholders
Use report APIs to create slides with images, text, and tables for Presentation and for Document, report and chapters with images, text, and tables.
-
For Document, the object's images, text, and tables need to be created
separately in the proper sequence. The chapter creation is optional, but
creating a chapter creates an automatic entry in the table of contents. Also,
while creating a chapter, you can specify the IDs of the objects to be included
in the chapter.
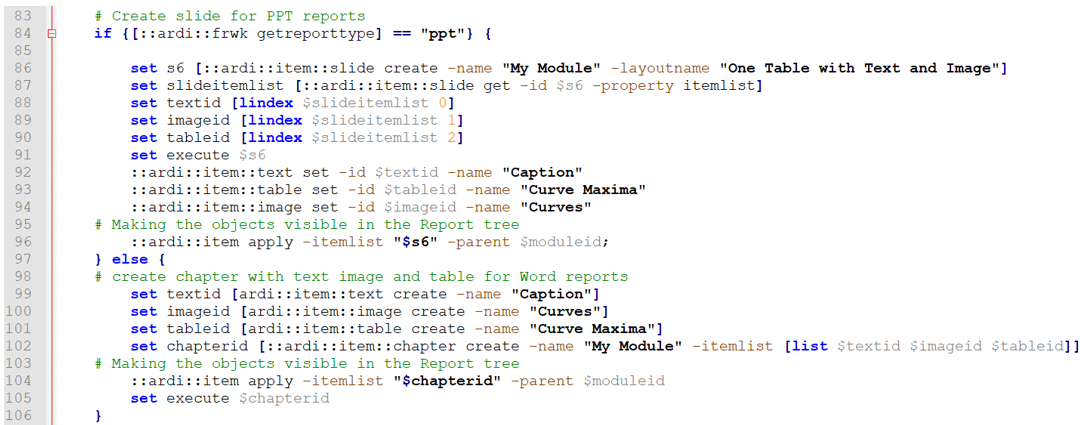
Figure 3. Report Object Creation
Populate Data
The objects created above can be populated with data obtained using the user logic. The IDs of the report objects are required in this step.
-
In the module example below, lines 107-121 illustrate the text box data caption
"Max values from curves", while the table headers are
set to visible and their content is set.
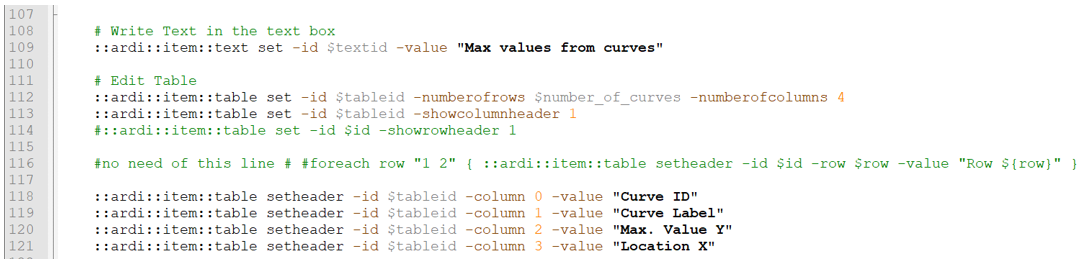
Figure 4. Populate Text and Table Information -
Image objects need a special execute operation. After execution, the temporary
notations on the screen must be removed and the previously visible entities need
to be restored. This is done from lines 156 to 167.
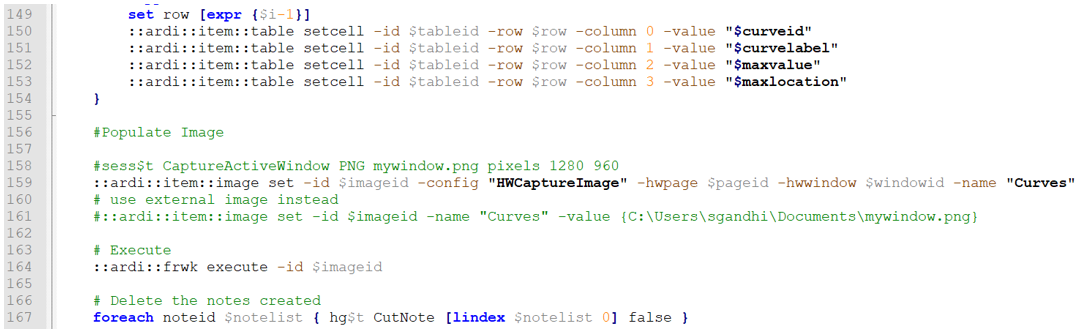
Figure 5. Populate table cells and images -
In addition to the execute block, other blocks exist in the tcl sample file.
Pre-execute and post-execute blocks can contain the code responsible for both
the presets before module execution and restoring the session to its original
form after module execution. For example, the entity overview module always
deletes all notes created for capturing images.
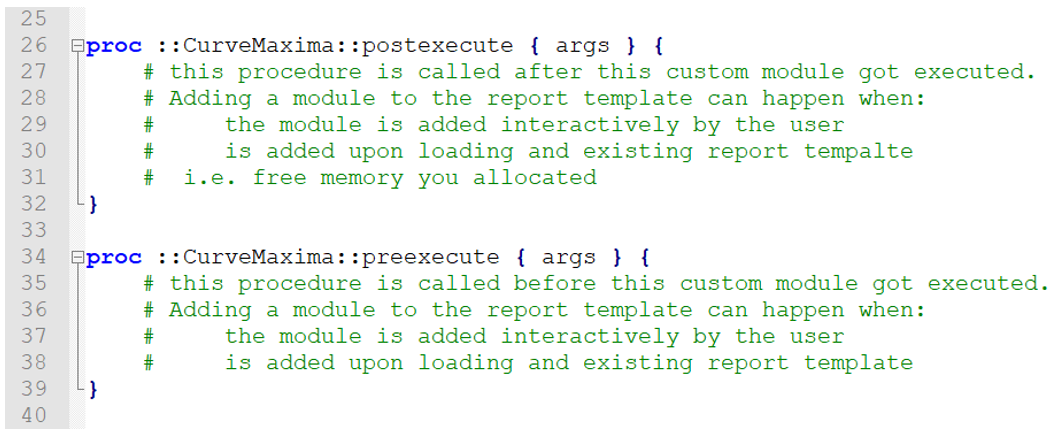
Figure 6. Pre-execute and Post-execute
Connect to the User Interface
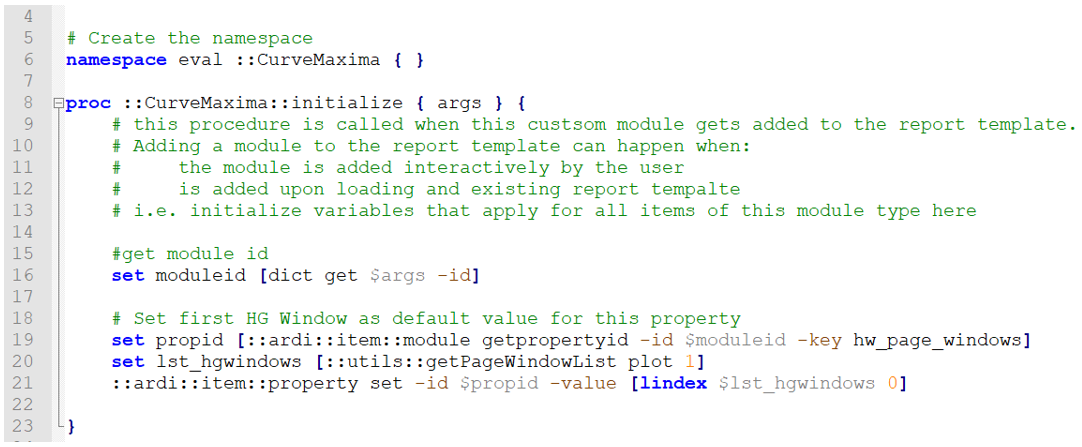
Figure 7. Initialization Block
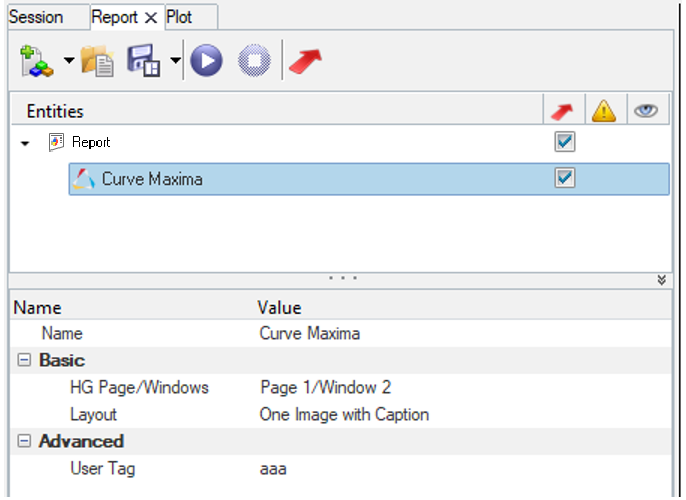
Figure 8. Module Property Area
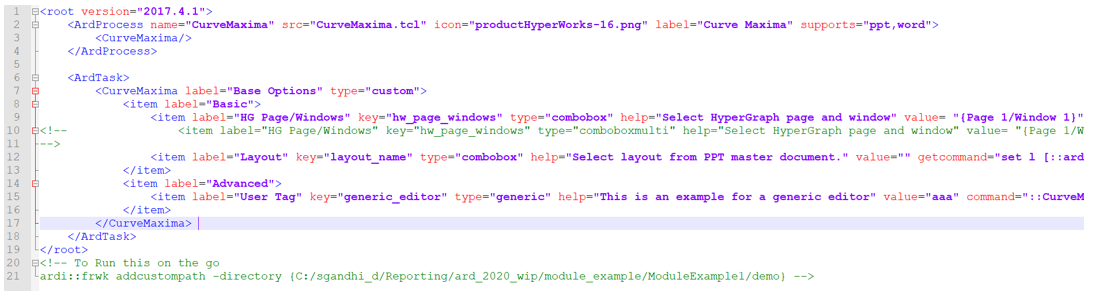
Figure 9. Module .xml Script for the Interface
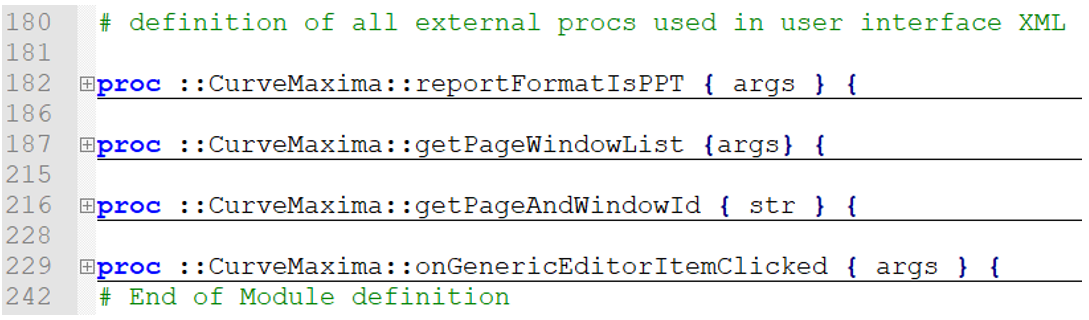
Figure 10. Functions for the User Interface
Register the Module
After finishing these steps, place the .xml and .tcl file in the appropriate location, preferably in the same folder. It is recommended to test this module in a HyperWorks session. For this, the module needs to be registered. This can be done in one of the following ways:
-
Use the environment variable ARD_CUSTOM_PATH.
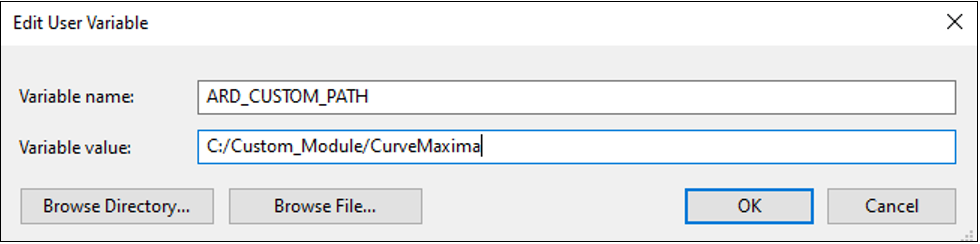
Figure 11. Register Module with Environment VariableNote: Keep the forward slash in the directory path. -
After running this, close and open the Report tab. For the selected Report
format, the custom module is listed along with the standard modules.
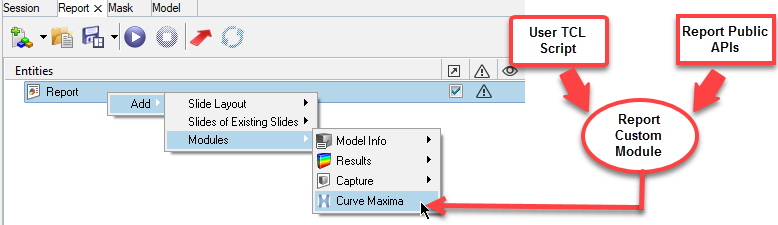
Figure 12. Custom and Standard Modules