DISPLACEMENT
I/O Options and Subcase Information Entry The DISPLACEMENT command can be used in the I/O Options or Subcase Information sections to request displacement vector output for all subcases or individual subcases, respectively.
Format
DISPLACEMENT (sorting, format, form, rotations, random, peakoutput, modal, nodal, fourier, complex eigenvalue analysis, type, TM=f, T1=f, T2=f, T3=f, RM=f, R1=f, R2=f, R3=f, kpi,statistics) = option
Definitions
| Argument | Options | Description |
|---|---|---|
| sorting | <SORT1, SORT2> | This argument only applies to the PUNCH format
(.pch file) or the OUTPUT2
format (.op2 file) output for Frequency
Response and Transient Analysis subcases. It will be ignored without
warning if used elsewhere.
|
| format | <HM, H3D, OPTI, PUNCH, OP2, PATRAN, HG, APATRAN, PLOT, HDF5, blank> |
|
| form | <COMPLEX, REAL,
IMAG, PHASE,
BOTH> Default (HM only) = COMPLEX Default (all other formats) = REAL |
|
| rotations | <ROTA, NOROTA> |
|
| random | <PSDF,
RMS, PSDFC> No default |
Output is available in the .h3d and
.h5 formats. 4
|
| peakoutput | <PEAKOUT> Default = blank |
If peakoutput is present, only the filtered frequencies from the PEAKOUT card will be considered for this output. |
| modal | <MODAL> Default = blank |
|
| nodal | <NODAL> Default = blank |
|
| fourier | <FREQ,
TIME> Default = blank |
Displacements output for Modal/Direct Transient Response Analysis with Fourier Transformation. |
| complex eigenvalue analysis 20 | <UNSTABLE> | Displacement results
|
| type | <NORMAL> |
|
| TM,T1,T2,T3 RM,R1,R2,R3 |
<f> Real > 0.0 Default = blank |
|
| kpi | <KPI> Default = blank |
|
| statistics | <STATIS, OSTATIS, or blank> | Results of Displacement Statistics over time in a Transient
Analysis are controlled by this option. 19
|
| option | <YES, ALL,
NO, NONE,
SID> Default = ALL |
|
Comments
- When DISPLACEMENT command is not present, displacement is output for all grids for all subcases, except for frequency response subcases.
- The form argument is only applicable for Frequency Response Analysis. It is ignored for other analysis types.
- The forms BOTH and COMPLEX do not apply to the .frf output files.
- Multiple formats are allowed on the same entry; these should be comma separated. If a format is not specified, this output control applies to all formats defined by the OUTPUT command, for which the result is available. See Results Output by OptiStruct for information on the results available and their respective formats.
- Multiple instances of this card are allowed. If instances are conflicting, the last instance dominates.
- For optimization, the frequency of output to a given format is controlled by the I/O option OUTPUT.
- Rotation results are output in radians.
- For normal modes output, if there is USET U6 data the static residual displacement vectors associated with the USET U6, DOF are also output to the PUNCH, H3D, and OUTPUT2 files.
- In general, HyperView does not recognize the SORT2 format for results from the .op2 file. When results are output only in SORT2 format (<Result Keyword> (SORT2, OUTPUT2, ...)), the results are written by OptiStruct into the .op2 file in SORT2 format, but when the .op2 file is imported into HyperView, the results in SORT2 format are not recognized. Therefore, the SORT1 option is recommended for results output in OUTPUT2 format and SORT2 option is recommended for results output in PUNCH format.
- Results in binary format (.h3d or .op2) are always output in PHASE/MAG form, regardless of the options specified in the FORM field. The corresponding post-processors (HyperView/HyperGraph) can easily convert the PHASE/MAG format to the required formats. Results in ASCII formats are output in the specified/requested FORM.
- The four-letter abbreviation DISP is interchangeable with DISPLACEMENT.
- format=OUTPUT2 can also be used to request results to be output in the Nastran output2 format (.op2 file).
- The FREQ and TIME options are only valid for Modal/Direct Transient Analysis with Fourier transformation. When FREQ is present, the displacements in frequency domain would be output in a dummy frequency subcase, which shares the same ID with the transient subcase.
- For NORMAL displacement output, the surface grids are automatically selected from within the specified GRID SET. Alternately, if option=ALL is input, the normal displacement is output for all surface grids in the model. Normal results are only available for Frequency Response Analysis and in the H3D format.
- If DISP(PLOT) is specified in conjunction with PARAM,POST,-1, then the typical default output requests are disabled. Required output can be requested explicitly for such runs (for example, using OUTPUT,H3D).
- The HDF5 output is printed to a
.h5 binary results file. For details of the supported
analysis types and elements when the .h5 output format is
requested, refer to the .h5 file.
For details about the old HDF5 format (.hdf5), refer to PARAM, HDF5 and .hdf5 file.
- Displacement output filters are supported for static and buckling analysis in H3D and PUNCH formats.
- KPI output includes maximum value for Displacement with respect to the corresponding property. It is supported for linear and nonlinear static analysis only. KPI output can also be output for a particular SET using the SID option.
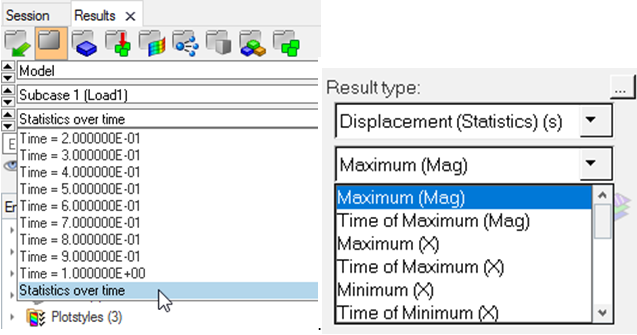
- Displacement Statistics are
supported for Direct and Modal Linear Transient Analysis types.
Only H3D output is supported for Displacement Statistics.
The following statistics over time are output for Transient Analysis when STATIS or OSTATIS is specified.- Statistics
- Supported Displacement Result Types
- Minimum and Time of Minimum
- X-component, Y-component, Z-component
- Maximum and Time of Maximum
- Magnitude, X-component, Y-component, Z-component
- Absolute Maximum and Time of Absolute Maximum
- X-component, Y-component, Z-component
- Arithmetic Mean, Root Mean Square (RMS), Variance, and Standard Deviation
- Magnitude, X-component, Y-component, Z-component
The displacement statistics can be viewed in HyperView after loading the H3D file, under Statistics over time option at the end of the timestep list in the Results Browser. Then, various statistics can be chosen from the sub-menu under Displacement (Statistics) (s).
Figure 1. - In aeroelastic divergence analysis with multiple Mach numbers, only H3D output is available.
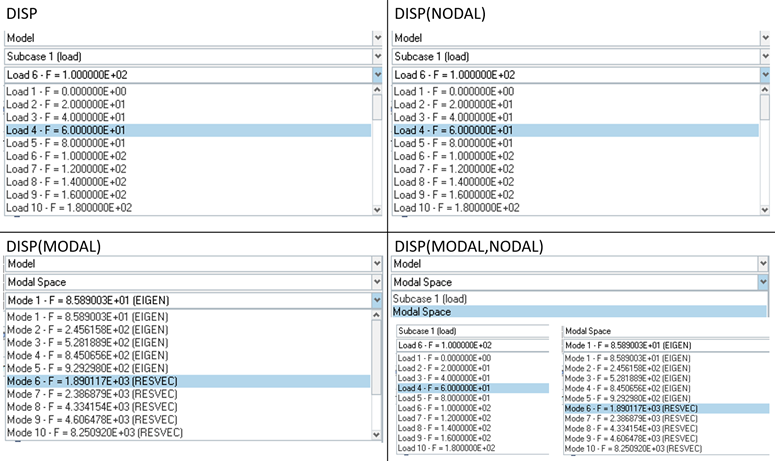
- If both MODAL
and NODAL options are present, then both eigenvector and
frequency/transient response results are output to the H3D, PCH, and OP2 files.
The output set IDs should match for both MODAL and
NODAL output.

Figure 2.