Use Plot Options to apply many options to the session at once during
plotting.
Curves created in this manner are added to the session in a new layer.
Note: The plot options you select take precedence over any Build Plots
panel options you have selected.
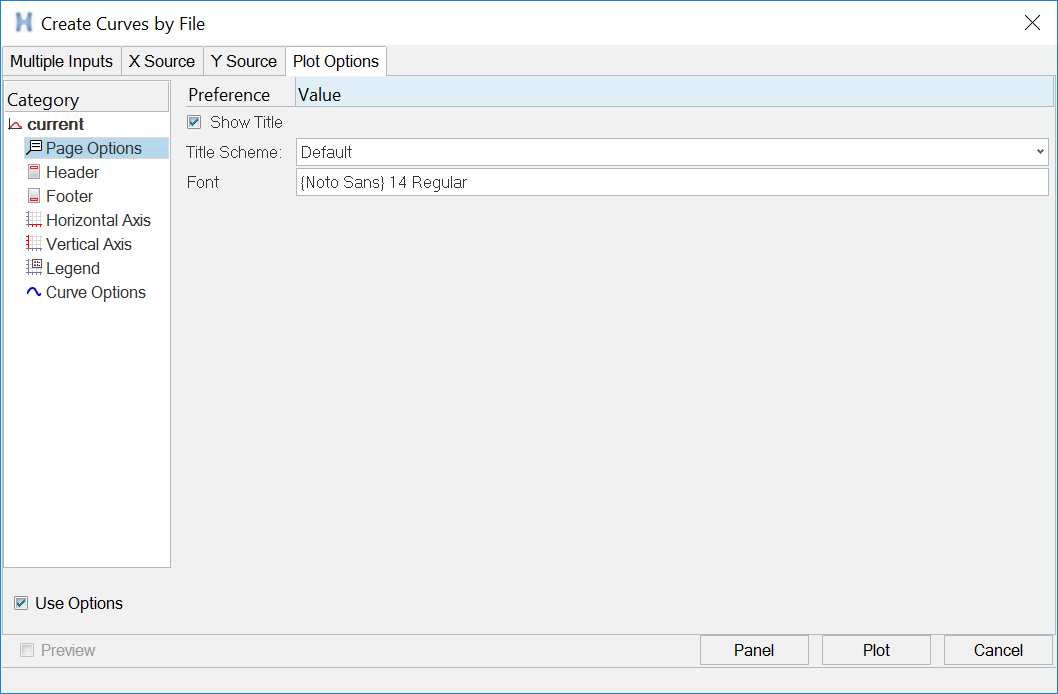
Figure 1.
Note: A curve must be specified in the Create Curves by File dialog before you can apply
options to it using Plot Options.
The Plot Options tab contains a tree on the left side and the Properties Table on the
right. From the tree, you can select the plot entity that you want to apply to the
curve. The Properties Table lists the properties and current values for the selected
plot entity.
You can modify the following plot entities:
Page Options
Show Title
Check to display the page title; uncheck to hide it (checkbox is enabled
by default).
Title
Templex-enabled edit field.
Font
Double-click the Font icon to display the Font Selector dialog and edit
the font type, size, and style.
Plot Options
Header
Show Header
Check to display the page header; uncheck to hide it (checkbox is
enabled by default).
Header
Click the field to select the file path, type, request, or component as
the header.
Primary Font
Double-click the Font icon to display the Font Selector dialog and edit
the font type, size, and style.
Alignment
Click in the field to select from Left, Center, or Right.
Footer
Show Footer
Check to display the page header; uncheck to hide it (checkbox is
disabled by default).
Footer
Click in the field to select the file path, type, request, or component
as the header.
Primary Font
Double-click the Font icon to display the Font Selector dialog and edit
the font type, size, and style
Alignment
Click in the field to select from Left, Center, or Right.
Horizontal Axis/Vertical Axis
Label
Click in the field to select the file path, type, request, or component
as the axis label.
Font
Double-click the Font icon to display the Font Selector dialog and edit
the font type, size, and style.
Scale
Click in the field to select from Linear, Logarithmic, dB20 (with
reference and weighting), and dB10 (with reference and weighting).
Fit Range
Check the Fit Range box to display the minimum and maximum fields.
Values will be ignored if you create curves in a populated plot
window.
Min
Enter a maximum value. Must be greater than 0 if the scale
is logarithmic, and less than maximum value.
Max
Enter a maximum value. Must be greater than 0 if the scale
is logarithmic, and greater than the minimum value.
Legend
Show Legend
Check to display the legend; uncheck to hide it (checkbox is enabled by
default).
Location
Click in the field to select the location of the legend from the
drop-down menu. Options include Inside Plot and Outside Plot.
Position
Click in the field to select the position of the legend from the
drop-down menu. Options include Left-Top corner, Left-Bottom corner,
Right-Top corner, and Right-Bottom corner).
Font
Double-click the Font icon to display the Font Selector dialog and edit
the font type, size, and style.
Curve Options
Math Expression
Check to enter math expressions to support U and V vectors. You can
perform math on curves prior to plotting your data with the support of u
and v vectors.
Show Prefix
Check to display the curve name prefix.
Label Prefix
Click on the field to select the file path, type, request, or component
as the curve label prefix.
Show Label
Check to display the curve name label.
Label
Click in the field to select the file path, type, request, or component
as part of the curve label.
Show Suffix
Check to display the curve name suffix.
Label Suffix
Click in the field to select the file path, type, request, or component
as the curve label suffix.
Line Color Scheme
Choose from HyperGraph defaults or All One Color.
Line Color
If you select All One Color for Line Color Scheme, the Line Color option
is displayed. Select a color from the palette.
Line Style Scheme
Choose from HyperGraph defaults or All One Color.
Line Style
If you select All One Style for Line Style Scheme, the Line Style option
is displayed. Select a line style from the drop-down menu.
Line Thickness Scheme
Choose from HyperGraph defaults or All One Color.
Line Thickness
If you select All One Thickness for Line Thickness Scheme, the Line
Thickness option is displayed. Select a line thickness from the
drop-down menu.
Symbol Scheme
Choose from HyperGraph defaults or All One Symbol
Symbol
If you select All One Symbol for Symbol Scheme, the Symbol option is
displayed. Select a symbol type from the drop-down menu.
Symbol Color
If you select All One Symbol for Symbol Scheme, the Symbol Color option
is displayed. Select a symbol color from the palette.
Symbol Frequency
If you select All One Symbol for Symbol Scheme, the Symbol Frequency
option is displayed. Enter a value in the field to indicate how often a
symbol is placed at a data point.
X Scalefactor
Click in the field to enter an x scale factor value.
X Offset
Click in the field to enter an x offset value.
Y Scalefactor
Click in the field to enter an y scale factor value.
Y Offset
Click in the field to enter an y offset value.
Start Index
The index number of the first data point in the subrange. The default is
1.
End Index
The index number of the last data point in the subrange. The default is
last.
Index Increment
The number of points to advance when reading the subrange. The default
is 1.