Tabulate Results
TableView creates an Excel-like spreadsheet in HyperWorks.
From TableView, click Table to view the TableView Table ribbon.
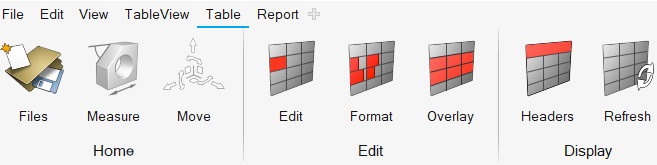
Figure 1. Table Ribbon
You can use Templex expressions inside of a cell to synchronize with HyperGraph and create summary tables that update accordingly using report templates. Value-dependent formatting allows for the easy detection of critical key performance indicators (KPI's). Basic spreadsheet functionality to format and edit table cells is also available. You can copy data from TableView and paste it into an Excel spreadsheet, and vice versa. You can also load large data sets into TableView.
Upon selection, the table's default size is 100x100. The image below displays curves on the left, with the curve data displayed on the right.
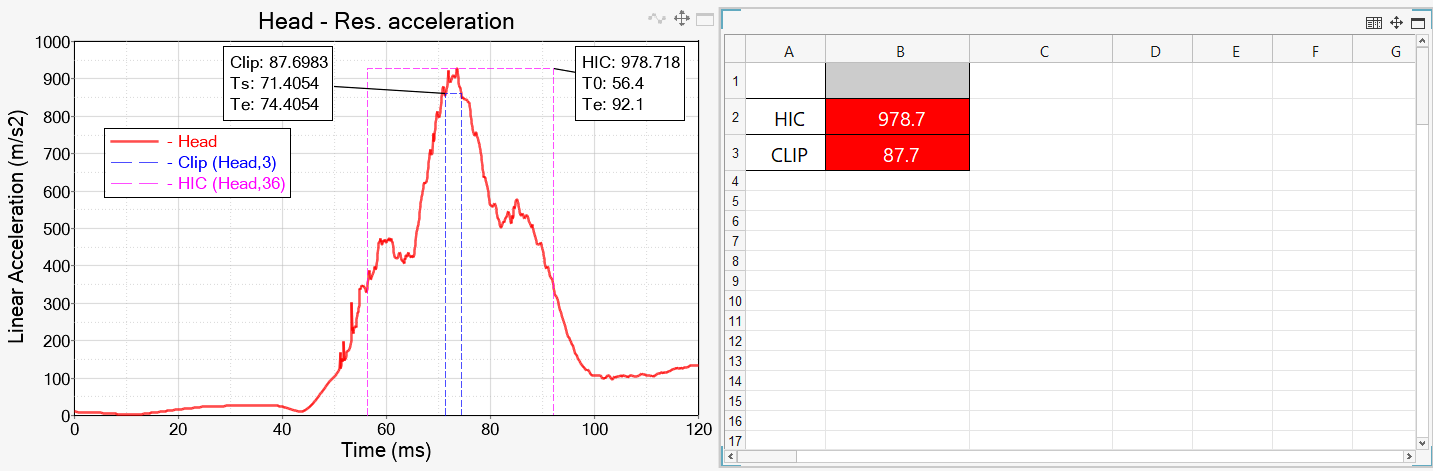 Figure 2. TableView Example