Contour time of failure or failure status of elements.
Failure Time is a special scalar result type that is created by HyperView based on Erosion (failed elements) data available in the
result file. No extra step is required; if the results contains Erosion, then a data type
called FailureTime is automatically created.
Attention: This is available in the HyperWorksHyperView – Upfront Loader profile only.
Three result components are available for contouring under the FailureTime result type:
Value
Contour plot will show the time at which an element fails.
Frame
Contour plot will show the animation frame number at which an element fails.
Status
Contour plot will show whether an element fails or not during the simulation.
Figure 1. Figure 2. Figure 3.
Note: The FailureTime contour plot is based on the steps that have
been loaded. For example, assume that a simulation has 50 steps, and no element fails in
the first 10 steps. If only the first 10 steps are loaded and FailureTime is contoured,
then the plot would show N/A. Therefore, it is recommended that all the steps of the
simulation be loaded before loading FailureTime in order to display precise failure
information on an element.
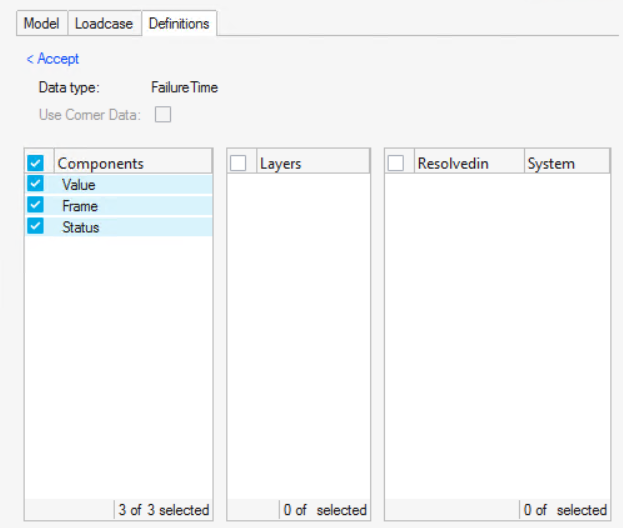 Figure 1.
 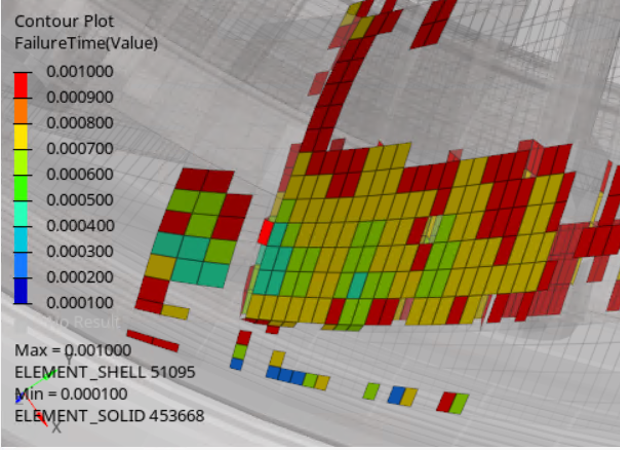 Figure 2.
 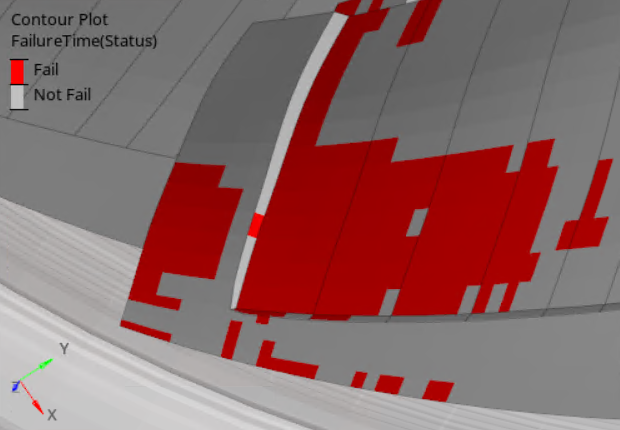 Figure 3.