Vibration and Acoustic Solutions
Acoustic Performance Analysis
To analyze optimum performance of speakers for high-quality sound with less noise, finite element analysis is performed.
Use-Case
Everyone wants great, high-quality, loud but clear sound from their audio system that fills the room with a deep bass and clear treble. The sound quality should not cause changes when the volume is turned up, and you certainly want to avoid vibrations, static hiss to come out of the speakers.
FEA Model Description
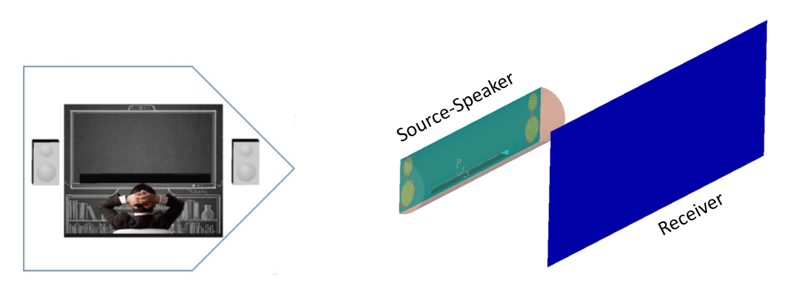
Figure 1. Speakers Acoustic Model
Results
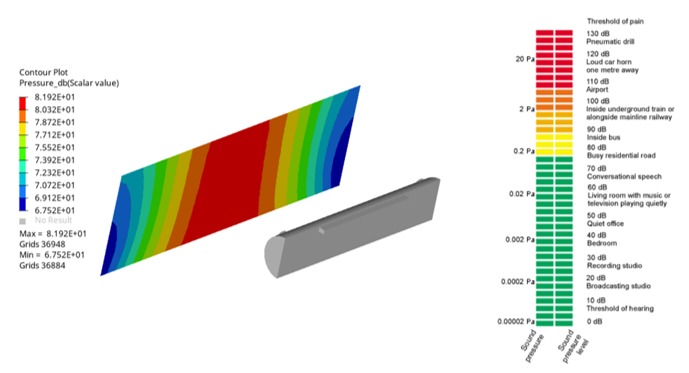
Figure 2. Pressure Intensity on the Receiver in db
Model FIle
Refer to Access the Model Files to download the required model file(s).
The model file used here includes:
Speaker_IE.fem
Vibro-Acoustic Analysis
OptiStruct provides a simulation-driven approach for the design of speakers to perceive the best quality sound.
Today, the loud speaker industry has been making immense advances in the design of speakers. Speakers are becoming miniaturized, compact and smart. As they continue to minimize the size, yet compacted with electronics, physical testing of such small devices become very cumbersome and expensive. For example, due to high vibrations produced in the speakers, the inside components tend to hit each other and produce a buzz and/or rattle. If two small wires or two plates are continually hitting or rubbing each other, it is difficult to locate the problem site itself because of such a compact environment inside the speaker. OptiStruct provides a good solution to visualize and diagnose the problem. The results from the OptiStruct simulation can be used for the designing of speakers for optimum performance.
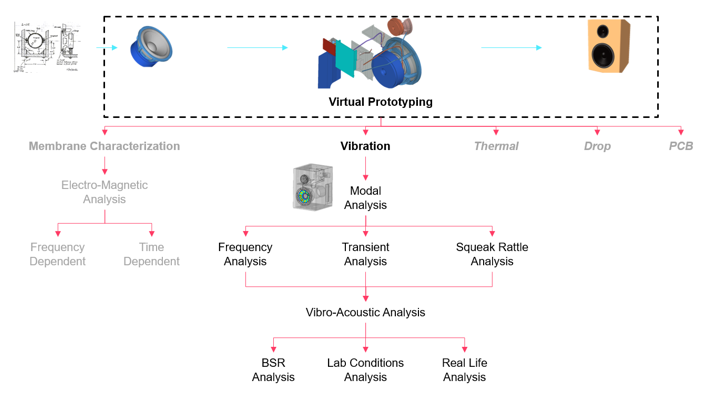
Figure 3. Analysis Types Performed on Speaker Model
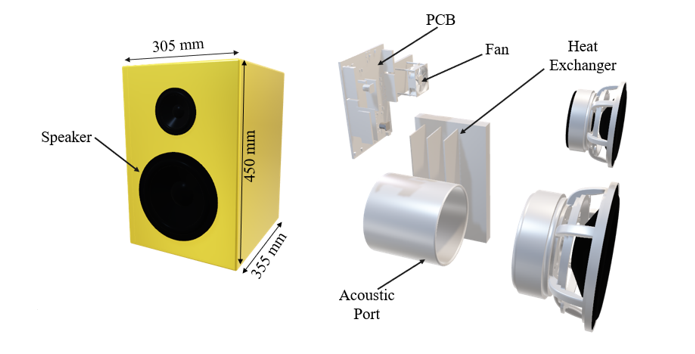
Figure 4. Speaker Model
Normal Modes Analysis
Use-Case
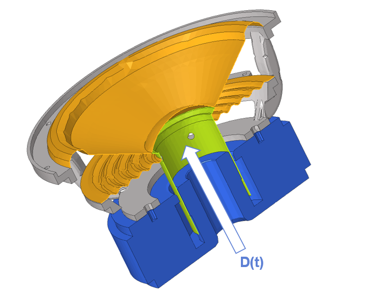
Figure 5. Physics of Speaker
FEA Model Description
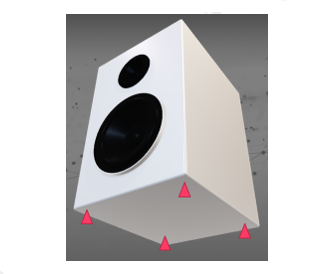
Figure 6. Modal Analysis - Model Setup
Results
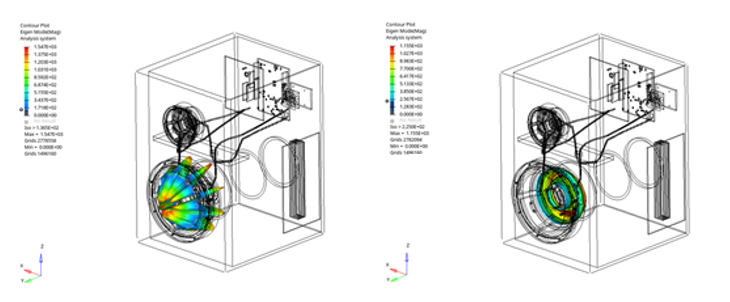
Figure 7. Mode Shapes of the Speaker Membrane
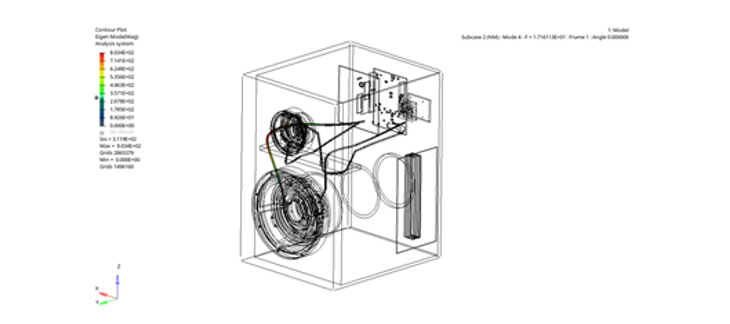
Figure 8. Mode Shapes of the Cables
Model File
Refer to Access the Model Files to download the required model file(s).
The model file used here includes:
speaker_normal_modes.fem
Frequency Response Analysis
Used to calculate the steady-state response of the structure, due to sinusoidal load applied at a single frequency.
Use-Case
Frequency Response Analysis is performed on speakers to know the vibration levels of the speakers at different locations of the assembly. You can identify any violated targets, diagnose the root cause of the failures and then optimize to meet the target. Hence, use Frequency Response Analysis to catch any extreme vibrations and optimize the speaker design. OptiStruct provides an option (PFMODE) to check the modal participation factor for all modal frequency response subcases. In this way, you can see which structural modes contribute maximum towards the response of our target points.
FEA Model Description
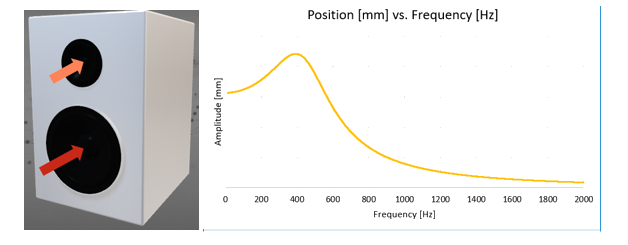
Figure 9. Load Applied to Two Speaker Membranes
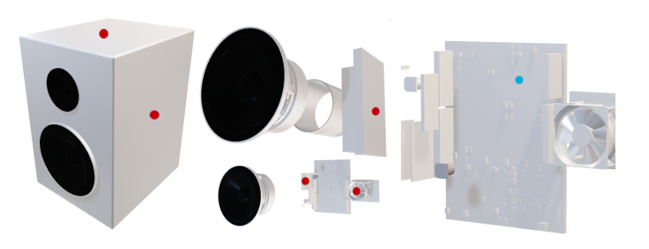
Figure 10. Locations of the Response Points
Results
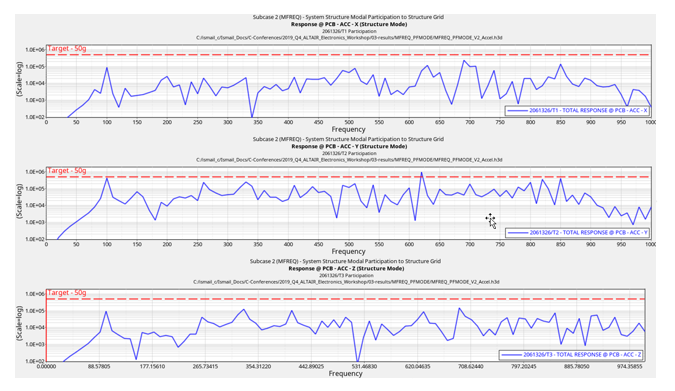
Figure 11. Response of PCB in X, Y and Z Direction
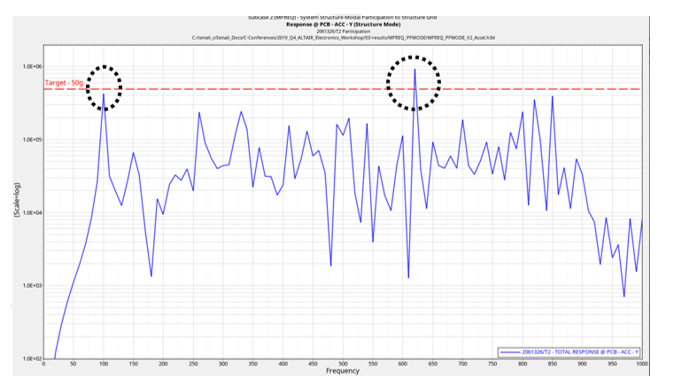
Figure 12. Violated Target at Two Frequencies
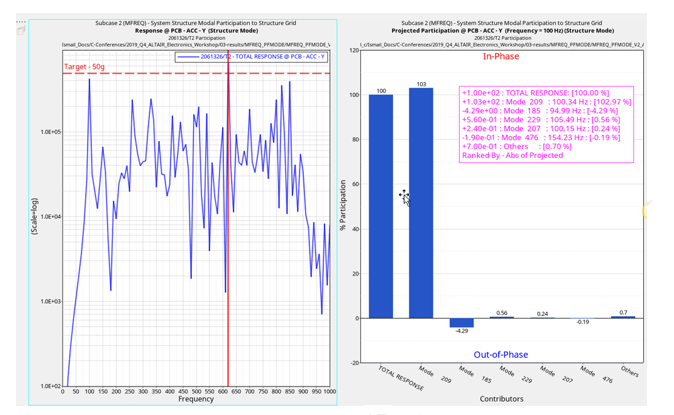
Figure 13. Modal Participation Factors for the Response in Y Direction
Model File
Refer to Access the Model Files to download the required model file(s).
The model file used here includes:
MFREQ_PFMODE.fem
Transient Analysis
Identify the dynamic response of the speaker assembly when it is subjected to time-dependent load. The motto of Transient Analysis is to track the overall displacement of the speaker and to check the relative motion of the springs with respect to the stationary clamped table.
Use-Case
Here a Modal Transient Analysis in OptiStruct is performed to visualize the vibrating motion of the speaker assembly which is supported on springs.
FEA Model Description
Figure 14. Loading on the Speaker Assembly
Results
Figure 15. Displacement of Spring Elements
Model File
Refer to Access the Model Files to download the required model file(s).
The model file used here includes:
MTRAN.fem
Acoustic Analysis
Acoustic modeling in infinite and semi-infinite domains is essential in the prediction of quantities such as external and radiated noise in vibro-acoustic problems. The different methods used for solving acoustic problems are described.
External Acoustic using Infinite Element Method: Use-Case
This method involves a smooth acoustic mesh (in this case, a sphere) around the structural mesh. The ends of the acoustic mesh are (surface of the acoustic sphere) have infinite elements.
FEA Model Description
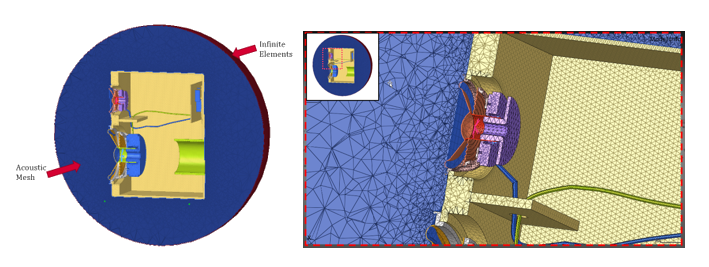
Figure 16. Acoustic Mesh with Infinite Elements
Results
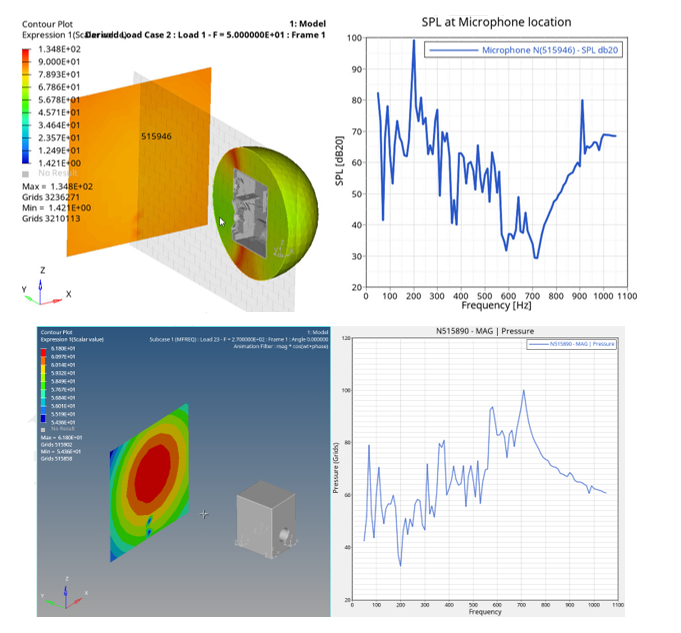
Figure 17. Pressure Plots for Two Microphone Points (N515956 and N515890)
Model File
Refer to Access the Model Files to download the required model file(s).
The model file used here includes:
Speaker_Infinite_Elements.fem
External Acoustic using RADSND Method
This method measures the radiated sound generated by vibrating nodes, assuming the nodes to be discrete acoustic sources.
Use-Case
This method does not require any acoustic mesh around the structure and; therefore, is faster to compute but the results obtained are approximate, not exact.
FEA Model Description
The speaker assembly is subjected to the load as was applied in Modal Frequency Analysis. The boundary conditions are the same in this scenario too. The microphones are located at 1 m to measure the sound pressure level.
Results
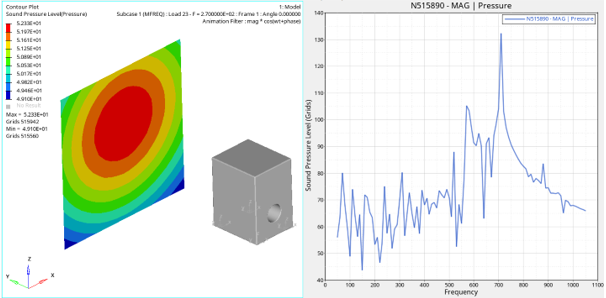
Figure 18. Pressure Plots for Microphone Point (N515890)
Model File
Refer to Access the Model Files to download the required model file(s).
The model file used here includes:
Speaker_RADSND.fem
Performance of Speaker Model
Here the sound pressure levels, as perceived by a human in its natural environment, are tested.
Use-Case
A speaker arrangement in a living room is showcased, where you query the sound pressure levels at different locations in the room and also check the effect of the speaker assembly rotation on the perceived sound pressure levels. Here, you will exemplify how OptiStruct offers an efficient platform to test the speakers in real-life settings versus against a lab setting (Physical tests), where the microphones are located only at pre-defined points.
Model Description
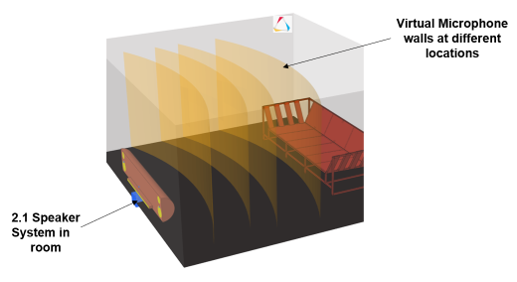
Figure 19. 15 Speaker Assembly in Living Room Setup
- Sound Pressure Levels when Speakers are directly facing the audience (angle
= 0°)
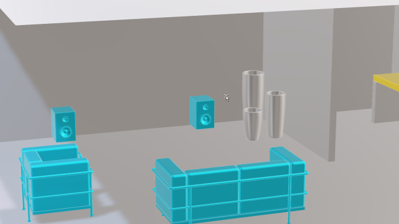
Figure 20. Speaker Assembly at 0° - Sound Pressure Levels when Speakers are rotated (angle = 30°)
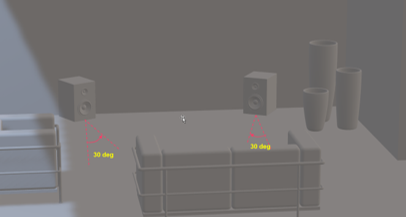
Figure 21. Speaker Assembly at 30°
Results
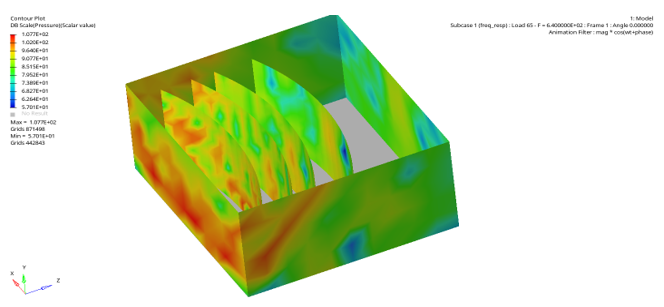
Figure 22. Variation of the Sound Pressure Levels . across the walls and different sections of the room
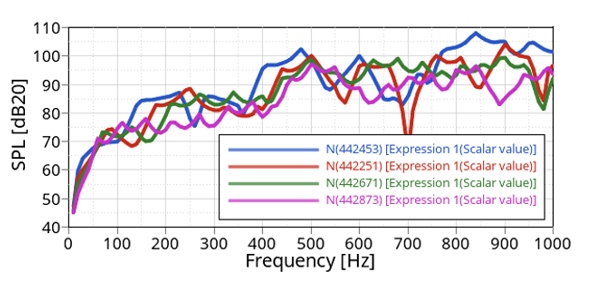
Figure 23. Sound Pressure Levels Comparison for 0° Speaker Orientation. at different locations in a living room setting
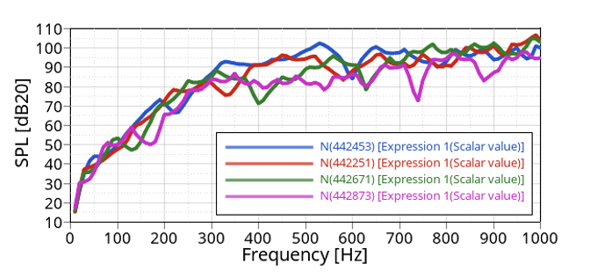
Figure 24. Sound Pressure Levels Comparison for 30° Speaker Orientation. at different locations of the room
Model File
Refer to Access the Model Files to download the required model file(s).
The model files used here includes:
0_degree_home.fem
30_degree_home.fem
Random Vibration Analysis
The structrual integrity is determined in this analysis.
- high acceleration levels
- high stress levels
- large displacement amplitudes
Frequency Response Analysis Use-Case
To analyze the critical area of PCB, first normal mode analysis is performed to calculate natural frequencies in the PCB.
Frequency Response Analysis Model Description
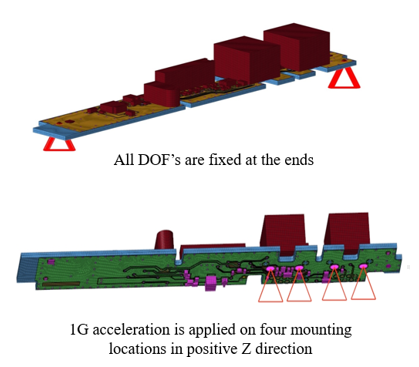
Figure 25. Frequency Response Analysis
Frequency Response Analysis Results
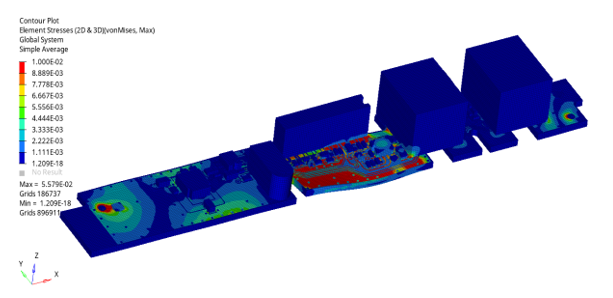
Figure 26. Maximum von Mises Stresses
Random Response Analysis Use-Case
Random Response Analysis is performed using results from FRF and adding a power spectral density graph of amplitude versus frequency up to 10000 HZ.
Random Response Analysis Results
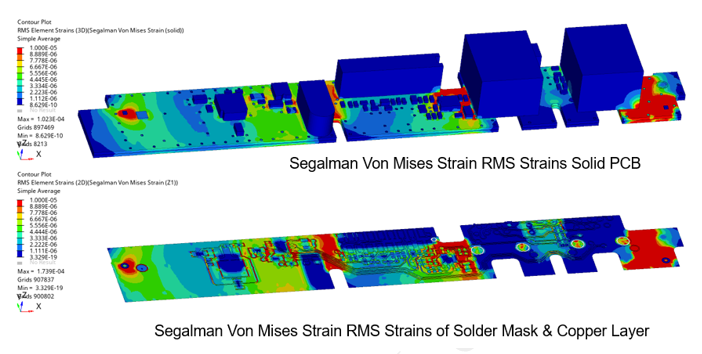
Figure 27. RMS Strains
Model File
Refer to Access the Model Files to download the required model file(s).
The model file used here includes:
PCB.fem