Punch File
Below is a list of the different types of Punch files available:
Acceleration
The Nastran Punch (PCH) format file contains various supported output across multiple solution sequences.
The output request initiation and corresponding parameters are controlled by the ACCELERATION I/O Options Entry and Subcase Information Entry.
- Solution Sequence
- Requested corresponding output parameters
This document contains details about PCH output for various solution sequences, with corresponding output parameters (wherever applicable). Example: PCH output from actual models are illustrated with information about the various sections of the output.
Similar PCH format documents are available for all supported output variables (STRESS, STRAIN, and so on). See the .pch file for a full list of supported output variables in conjunction with PCH output format, along with a link to each detailed PCH format documents.
General Acceleration PCH Format (File Specification)
The information in the PCH file varies depending on the requested output; however, some parts of the PCH file are common and the syntax is similar across most output data.
The PCH file consists of data blocks, each containing corresponding information for the listed Subcase or the subsequent subset data (for example, eigenvalue or time step).
Each data block is printed with the following format.
Line 1 - $TITLE = This represents the Solver Name (OptiStruct) and the version Number (for example,
14.0.220).
Line 2 - $SUBTITLE =
Line 3 - $LABEL = This is the label of the Current Subcase (this is
input in the model)
Line 4 - $<result type> = This represents the type of results
being printed in this data block.
Line 5 - $SUBCASE ID = This represents the ID of the subcase for
which the results are printed in this data block. The $LABEL field
in line 3 corresponds to this subcase.
Frequency Response Analysis
The supported Acceleration output parameters for Frequency Response Analysis.
General (Default)

Figure 1.
Sorted Output

Figure 2. SORT2 Argument Sorts Results Wherein Grid/Elements are Grouped Together
Output Form (form)

Figure 3. PHASE Argument Provides Output in the Polar Format
Filtered Output (peakoutput)
Output can be filtered based on the loading frequencies at which specified result peaks occur. This can be controlled on the PEAKOUT Bulk Data Entry. The format for the PCH output is the same as those shown in previous sections. The output is just a smaller subset of loading frequencies.
Normal Acceleration (type)
Normal Acceleration results for grid points on the surface of shell and solid elements are output. The NORMAL argument can be used to generate this output. Currently NORMAL Acceleration results are not available in the PCH file.
- Number
- Result Type
- 1
- Grid ID at which MPCFORCE is requested
- 2
- The character “G” identifying that the results are for a particular grid
- 3
- Real part of the Translational MPCFORCE along X
- 4
- Real part of the Translational MPCFORCE along Y
- 5
- Real part of the Translational MPCFORCE along Z
- 6
- Real part of the Rotational MPCFORCE (MPC Moment) along X
- 7
- Real part of the Rotational MPCFORCE (MPC Moment) along Y
- 8
- Real part of the Rotational MPCFORCE (MPC Moment) along Z
- 9
- Imaginary part of the Translational MPCFORCE along X
- 10
- Imaginary part of the Translational MPCFORCE along Y
- 11
- Imaginary part of the Translational MPCFORCE along Z
- 12
- Imaginary part of the Rotational MPCFORCE (MPC Moment) along X
- 13
- Imaginary part of the Rotational MPCFORCE (MPC Moment) along Y
- 14
- Imaginary part of the Rotational MPCFORCE (MPC Moment) along Z
Random Response Analysis
The supported Acceleration output parameters for Random Response Analysis.
General (Default) or Random Output (random)

Figure 4.
Linear Transient Analysis
The supported Acceleration output parameters for Linear Transient Analysis.
General (Default)
Figure 5.
Sorted Output
Figure 6. SORT1 Argument Sorts Results Wherein Time Steps are Grouped Together
Linear Transient Analysis by Fourier Transformation
The supported Acceleration output parameters for Linear Transient Analysis by Fourier Transformation.
General (Default)
For Acceleration results with the default settings, for example if ACCELERATION(PUNCH)=ALL/SID is used, the output is presented in the same format as Linear Transient Analysis.
Displacement
The Nastran Punch (PCH) format file contains various supported output across multiple solution sequences.
The output request initiation and corresponding parameters are controlled by the DISPLACEMENT I/O Options Entry and Subcase Information Entry.
- Solution Sequence
- Requested corresponding output parameters
This document contains details about PCH output for various solution sequences, with corresponding output parameters (wherever applicable). Example: PCH output from actual models are illustrated with information about the various sections of the output.
Similar PCH format documents are available for all supported output variables (STRESS, STRAIN, and so on). See the .pch file for a full list of supported output variables in conjunction with PCH output format, along with a link to each detailed PCH format documents.
General Displacement PCH Format (File Specification)
The information in the PCH file varies depending on the requested output, however, some parts of the PCH file are common and the syntax is similar across most output data.
The PCH file consists of data blocks, each containing corresponding information for the listed Subcase or the subsequent subset data (for example, eigenvalue or time step).
Each data block is printed with the following format.
Line 1 - $TITLE = This represents the Solver Name (OptiStruct) and the version Number (for example,
14.0.220).
Line 2 - $SUBTITLE =
Line 3 - $LABEL = This is the label of the Current Subcase (this is
input in the model)
Line 4 - $<result type> = This represents the type of results
being printed in this data block.
Line 5 - $SUBCASE ID = This represents the ID of the subcase for
which the results are printed in this data block. The $LABEL field
in line 3 corresponds to this subcase.
Frequency Response Analysis
The supported Displacement output parameters for Frequency Response Analysis.
General (Default)

Figure 7.
Sorted Output

Figure 8. SORT2 Argument Sorts Results Wherein Grid/Elements Are Grouped Together
Output Form (form)

Figure 9. PHASE Argument Provides Output in the Polar Format
Filtered Output (peakoutput)
Output can be filtered based on the loading frequencies at which specified result peaks occur. This can be controlled on the PEAKOUT Bulk Data Entry. The format for the PCH output is the same as those shown in previous sections. The output is just a smaller subset of loading frequencies.
Modal Output (modal)

Figure 10.
Normal Displacement (type)
Normal displacement results for grid points on the surface of shell and solid elements are output. The NORMAL argument can be used to generate this output. Currently NORMAL displacement results are not available in the PCH file.
Random Response Analysis
The supported Displacement output parameters for Random Response Analysis.
General (Default) or Random Output (random)

Figure 11.
Linear Transient Analysis
The supported Displacement output parameters for Linear Transient Analysis.
General (Default)
Figure 12.
Sorted Output
Figure 13. SORT1 Argument Sorts Results Wherein Time Steps are Grouped Together
Modal Output (modal)
Modal displacements can be output for any Modal Transient Response Subcase with the MODAL argument. The modal displacements will be output; however, corresponding Transient Analysis displacements are not output in conjunction. Therefore, either Transient Analysis displacements are output (without MODAL argument) or Modal displacements are output (with MODAL argument).
Figure 14. SORT1, MODAL
Figure 15. SORT2, MODAL
Linear Transient Analysis by Fourier Transformation
The supported Displacement output parameters for Linear Transient Analysis by Fourier Transformation.
General (Default)
For Displacement results with the default settings, for example if DISPLACEMENT(PUNCH)=ALL/SID is used, the output is presented in the same format as Linear Transient Analysis.
Linear and Nonlinear Static Analysis
The supported Displacement output parameters for Linear Static Analysis.
General (Default)

Figure 16.
Linear Buckling Analysis
The supported Displacement output parameters for Linear Buckling Analysis.
General (Default)

Figure 17.
Normal Modes Analysis
The supported Displacement output parameters for Normal Modes Analysis.
General (Default)

Figure 18.
Complex Eigenvalue Analysis
The supported Displacement output parameters for Complex Eigenvalue Analysis.
General (Default)

Figure 19.
Output Form (form)

Figure 20. PHASE Argument Provides Output in the Polar Format
Unstable Mode Output (complex eigenvalue analysis)

Figure 21.
Response Spectrum Analysis
The supported Displacement output parameters for Response Spectrum Analysis.
General (Default)

Figure 22.

Figure 23.

Figure 24.

Figure 25.
Stress
The Nastran Punch (PCH) format file contains various supported output across multiple solution sequences.
The output request initiation and corresponding parameters are controlled by the STRESS I/O Options Entry and Subcase Information Entry.
- Solution Sequence
- Requested corresponding output parameters
This document contains details about PCH output for various solution sequences, with corresponding output parameters (wherever applicable). Example: PCH output from actual models are illustrated with information about the various sections of the output.
Similar PCH format documents are available for all supported output variables (STRAIN, ESE, and so on). See the .pch file for a full list of supported output variables in conjunction with PCH output format, along with a link to each detailed PCH format documents.
General Stress PCH Format (File Specification)
The information in the PCH file varies depending on the requested output, however, some parts of the PCH file are common and the syntax is similar to most output data.
The PCH file consists of data blocks, each containing corresponding information for the listed Subcase or the subsequent subset data (for example, eigenvalue or time step).
Each data block is printed with the following format.
Line 1 - $TITLE = This represents the Solver Name (OptiStruct) and the version Number (for example,
14.0.220).
Line 2 - $SUBTITLE =
Line 3 - $LABEL = This is the label of the Current Subcase (this is
input in the model)
Line 4 - $<result type> = This represents the type of results
being printed in this data block.
Line 5 - $SUBCASE ID = This represents the ID of the subcase for
which the results are printed in this data block. The $LABEL field
in line 3 corresponds to this subcase.
Frequency Response Analysis
The supported Stress output parameters for Frequency Response Analysis.
For Stress results, output is presented in the following format. The format for elemental results such as stress is dependent on the element type. Therefore, the following sections illustrate the format and stress entities for each element type.
1D Elements
Frequency response stress results may be output in Real/Imaginary or Magnitude/Phase formats via the REAL/IMAG or PHASE arguments, respectively on the STRESS entry.
Frequency response stress results may be output in either SORT1 or SORT2 formats. The following information is presented in SORT1 format (which is the default for Frequency Response analysis).
CBEAM
- Number
- Result Type
- 1
- CBEAM Element ID
- 2
- CBEAM Grid ID
- 3
- Station/Location Distance along the beam where stress is output
- 4
- Real Part (or Magnitude) of Longitudinal Stress at Point C
- 5
- Real Part (or Magnitude) of Longitudinal Stress at Point D
- 6
- Real Part (or Magnitude) of Longitudinal Stress at Point E
- 7
- Real Part (or Magnitude) of Longitudinal Stress at Point F
- 8
- Imaginary Part (or Phase) of Longitudinal Stress at Point C
- 9
- Imaginary Part (or Phase) of Longitudinal Stress at Point D
- 10
- Imaginary Part (or Phase) of Longitudinal Stress at Point E
- 11
- Imaginary Part (or Phase) of Longitudinal Stress at Point F
- 12
- The above result block from entry 2 to 11 is repeated for all intermediate stations and the other end of the beam. Currently intermediate stations are not supported and are output as 0.0.
Stress Results are output at ends A and B at stress recovery points C, D, E, and F. For PBEAM, the stress recovery points are user-defined on the PBEAM Bulk Data Entry. For PBEAML, the stress recovery points are automatically defined by the beam type and dimensions. Stress recovery at intermediate stations along the CBEAM element is currently not supported.
CBAR
- Number
- Results Type
- 1
- CBAR Element ID
- 2
- Real Part (or Magnitude) of Bending Stress at Point C of End A
- 3
- Real Part (or Magnitude) of Bending Stress at Point D of End A
- 4
- Real Part (or Magnitude) of Bending Stress at Point E of End A
- 5
- Real Part (or Magnitude) of Bending Stress at Point F of End A
- 6
- Real Part (or Magnitude) of Axial Stress
- 7
- Imaginary Part (or Phase) of Bending Stress at Point C of End A
- 8
- Imaginary Part (or Phase) of Bending Stress at Point D of End A
- 9
- Imaginary Part (or Phase) of Bending Stress at Point E of End A
- 10
- Imaginary Part (or Phase) of Bending Stress at Point F of End A
- 11
- Imaginary Part (or Phase) of Axial Stress
- 12
- Real Part (or Magnitude) of Bending Stress at Point C of End B
- 13
- Real Part (or Magnitude) of Bending Stress at Point D of End B
- 14
- Real Part (or Magnitude) of Bending Stress at Point E of End B
- 15
- Real Part (or Magnitude) of Bending Stress at Point F of End B
- 16
- Imaginary Part (or Phase) of Bending Stress at Point C of End B
- 17
- Imaginary Part (or Phase) of Bending Stress at Point D of End B
- 18
- Imaginary Part (or Phase) of Bending Stress at Point E of End B
- 19
- Imaginary Part (or Phase) of Bending Stress at Point F of End B
Stress Results are output at ends A and B at stress recovery points C, D, E, and F. For PBAR, the stress recovery points are user-defined on the PBAR Bulk Data Entry. For PBARL, the stress recovery points are automatically defined by the beam type and dimensions.
CELAS
- Number
- Results Type
- 1
- CELAS Element ID
- 2
- Real Part (or Magnitude) of Stress along component listed on CELAS entry
- 3
- Imaginary Part (or Phase) of Stress along component listed on CELAS entry
CROD
- Number
- Results Type
- 1
- CROD Element ID
- 2
- Real Part (or Magnitude) of Axial Stress
- 3
- Imaginary Part (or Phase) of Axial Stress
- 4
- Real Part (or Magnitude) of Torsional Stress
- 5
- Imaginary Part (or Phase) of Torsional Stress
CTUBE element results are listed as CROD results in the .pch file.
CWELD
CWELD results are not supported in Frequency Response Analysis in the PCH file.
CBUSH
- Number
- Results Type
- 1
- CBUSH Element ID
- 2
- Real Part (or Magnitude) of Stress Translational X
- 3
- Real Part (or Magnitude) of Stress Translational Y
- 4
- Real Part (or Magnitude) of Stress Translational Z
- 5
- Real Part (or Magnitude) of Stress Moment X
- 6
- Real Part (or Magnitude) of Stress Moment Y
- 7
- Real Part (or Magnitude) of Stress Moment Z
- 2
- Imaginary Part (or Phase) of Stress Translational X
- 3
- Imaginary Part (or Phase) of Stress Translational Y
- 4
- Imaginary Part (or Phase) of Stress Translational Z
- 5
- Imaginary Part (or Phase) of Stress Moment X
- 6
- Imaginary Part (or Phase) of Stress Moment Y
- 7
- Imaginary Part (or Phase) of Stress Moment Z
Element Stress results are not output for CFAST elements in the .pch file.
2D Elements
The type of stress information printed for 2D elements (CQUAD4, CQUAD8, CTRIA3, and CTRIA6) is common. However, the results format and information depends on the results location requested on the STRESS entry. Frequency response stress results may be output in Real/Imaginary or Magnitude/Phase formats via the REAL/IMAG or PHASE arguments, respectively on the STRESS entry.
- Number
- Results Type
- 1
- 2D Element ID
- 2
- Fiber Distance (at location Z1 defined on PSHELL)
- 3
- Real Part (or Magnitude) of Normal XX Stress (at location Z1 defined on PSHELL)
- 4
- Imaginary Part (or Phase) of Normal XX Stress (at location Z1 defined on PSHELL)
- 5
- Real Part (or Magnitude) of Normal YY Stress (at location Z1 defined on PSHELL)
- 6
- Imaginary Part (or Phase) of Normal YY Stress (at location Z1 defined on PSHELL)
- 7
- Real Part (or Magnitude) of Shear XY Stress (at location Z1 defined on PSHELL)
- 8
- Imaginary Part (or Phase) of Shear XY Stress (at location Z1 defined on PSHELL)
- 9
- Fiber Distance (at location Z2 defined on PSHELL)
- 10
- Real Part (or Magnitude) of Normal XX Stress (at location Z2 defined on PSHELL)
- 11
- Imaginary Part (or Phase) of Normal XX Stress (at location Z2 defined on PSHELL)
- 12
- Real Part (or Magnitude) of Normal YY Stress (at location Z2 defined on PSHELL)
- 13
- Imaginary Part (or Phase) of Normal YY Stress (at location Z2 defined on PSHELL)
- 14
- Real Part (or Magnitude) of Shear XY Stress (at location Z2 defined on PSHELL)
- 15
- Imaginary Part (or Phase) of Shear XY Stress (at location Z2 defined on PSHELL)
- Number
- Results Type
- 1
- 2D Element ID
- 2
- CEN/ flag identifying that the current result block displays element center results.
- 3
- An Integer listing the number of grid points of the element at which results are output in the subsequent block after the central results.
- 4
- Fiber Distance (at location Z1 defined on PSHELL)
- 5
- Real Part (or Magnitude) of Normal XX Stress (at location Z1 defined on PSHELL)
- 6
- Imaginary Part (or Phase) of Normal XX Stress (at location Z1 defined on PSHELL)
- 7
- Real Part (or Magnitude) of Normal YY Stress (at location Z1 defined on PSHELL)
- 8
- Imaginary Part (or Phase) of Normal YY Stress (at location Z1 defined on PSHELL)
- 9
- Real Part (or Magnitude) of Shear XY Stress (at location Z1 defined on PSHELL)
- 10
- Imaginary Part (or Phase) of Shear XY Stress (at location Z1 defined on PSHELL)
- 11
- Fiber Distance (at location Z2 defined on PSHELL)
- 12
- Real Part (or Magnitude) of Normal XX Stress (at location Z2 defined on PSHELL)
- 13
- Imaginary Part (or Phase) of Normal XX Stress (at location Z2 defined on PSHELL)
- 14
- Real Part (or Magnitude) of Normal YY Stress (at location Z2 defined on PSHELL)
- 15
- Imaginary Part (or Phase) of Normal YY Stress (at location Z2 defined on PSHELL)
- 16
- Real Part (or Magnitude) of Shear XY Stress (at location Z2 defined on PSHELL)
- 17
- Imaginary Part (or Phase) of Shear XY Stress (at location Z2 defined on PSHELL)
- 18
- Grid Point ID at which stress results are output in the subsequent block.
- 19
- Fiber Distance (at location Z1 defined on PSHELL)
- 20
- Real Part (or Magnitude) of Normal XX Stress (at location Z1 defined on PSHELL)
- 21
- Imaginary Part (or Phase) of Normal XX Stress (at location Z1 defined on PSHELL)
- 22
- Real Part (or Magnitude) of Normal YY Stress (at location Z1 defined on PSHELL)
- 23
- Imaginary Part (or Phase) of Normal YY Stress (at location Z1 defined on PSHELL)
- 24
- Real Part (or Magnitude) of Shear XY Stress (at location Z1 defined on PSHELL)
- 25
- Imaginary Part (or Phase) of Shear XY Stress (at location Z1 defined on PSHELL)
- 26
- Fiber Distance (at location Z2 defined on PSHELL)
- 27
- Real Part (or Magnitude) of Normal XX Stress (at location Z2 defined on PSHELL)
- 28
- Imaginary Part (or Phase) of Normal XX Stress (at location Z2 defined on PSHELL)
- 29
- Real Part (or Magnitude) of Normal YY Stress (at location Z2 defined on PSHELL)
- 30
- Imaginary Part (or Phase) of Normal YY Stress (at location Z2 defined on PSHELL)
- 31
- Real Part (or Magnitude) of Shear XY Stress (at location Z2 defined on PSHELL)
- 32
- Imaginary Part (or Phase) of Shear XY Stress (at location Z2 defined on PSHELL)
- 33
- Items 18 to 32 are repeated in sequence for all grid points of the element ID mentioned in item 1. The number of grid points for each element is mentioned in item 3.
GAUSS results are currently not supported for PCH output.
3D Elements
The type and formatting of stress information printed for 3D elements (CHEXA, CTETRA, and CPENTA) is common. The order of information printed in the .pch file is:
- Number
- Results Type
- 1
- 3D Element ID
- 2
- Placeholder negative integer (-1).
- 3
- GRID flag
- 4
- Number of Grids at which results are output for the element mentioned in item 1 (set to 0 if only element center results are requested).
- 5
- CENTER flag indicating that element center results are output in the following block.
- 6
- Real Part (or Magnitude) of Normal XX Stress
- 7
- Real Part (or Magnitude) of Normal YY Stress
- 8
- Real Part (or Magnitude) of Normal ZZ Stress
- 9
- Real Part (or Magnitude) of Shear XY Stress
- 10
- Real Part (or Magnitude) of Shear YZ Stress
- 11
- Real Part (or Magnitude) of Shear ZX Stress
- 12
- Imaginary Part (or Phase) of Normal XX Stress
- 13
- Imaginary Part (or Phase) of Normal YY Stress
- 14
- Imaginary Part (or Phase) of Normal ZZ Stress
- 15
- Imaginary Part (or Phase) of Shear XY Stress
- 16
- Imaginary Part (or Phase) of Shear YZ Stress
- 17
- Imaginary Part (or Phase) of Shear ZX Stress
- 18
- Grid ID for which the subsequent result block is output.
- 19
- Real Part (or Magnitude) of Normal XX Stress
- 20
- Real Part (or Magnitude) of Normal YY Stress
- 21
- Real Part (or Magnitude) of Normal ZZ Stress
- 22
- Real Part (or Magnitude) of Shear XY Stress
- 23
- Real Part (or Magnitude) of Shear YZ Stress
- 24
- Real Part (or Magnitude) of Shear ZX Stress
- 25
- Imaginary Part (or Phase) of Normal XX Stress
- 26
- Imaginary Part (or Phase) of Normal YY Stress
- 27
- Imaginary Part (or Phase) of Normal ZZ Stress
- 28
- Imaginary Part (or Phase) of Shear XY Stress
- 29
- Imaginary Part (or Phase) of Shear YZ Stress
- 30
- Imaginary Part (or Phase) of Shear ZX Stress
- 31
- Items 18 to 30 are repeated in sequence for all grid points of the element ID mentioned in item 1. The number of grid points for each element is mentioned in item 3.
GAUSS results are currently not supported for PCH output.
Random Response Analysis
The supported Stress output parameters for Random Response Analysis.
General (Default) or Random Output (random)
For Stress results with the default settings, for example if STRESS(PUNCH)=ALL/SID is used, the output is presented in the following format.
For Random Response Analysis, the Stress results are basically Power Spectral Density Stress values for each loading. PSD output (via PSDF argument) and RMS total over all frequencies are output to the PCH file. RMS cumulative up to a particular frequency are not printed to the PCH file.
1D Elements
CBEAM
- Number
- Result Type
- 1
- CBEAM Element ID
- 2
- CBEAM Grid ID
- 3
- Station/Location Distance along the beam where stress is output
- 4
- Longitudinal PSDF/RMS-over-Frequencies Stress at Point C
- 5
- Longitudinal PSDF/RMS-over-Frequencies Stress at Point D
- 6
- Longitudinal PSDF/RMS-over-Frequencies Stress at Point E
- 7
- Longitudinal PSDF/RMS-over-Frequencies Stress at Point F
- 8
- The above result block is repeated for all intermediate stations and the other end of the beam. Currently intermediate stations are not supported and are output as 0.0.
Stress Results are output at ends A and B at stress recovery points C, D, E, and F. For PBEAM, the stress recovery points are user-defined on the PBEAM Bulk Data Entry. For PBEAML, the stress recovery points are automatically defined by the beam type and dimensions. Stress recovery at intermediate stations along the CBEAM element is currently not supported.
CBAR
- Number
- Result Type
- 1
- CBAR Element ID
- 2
- Bending PSDF/RMS-over-Frequencies Stress at Point C of End A
- 3
- Bending PSDF/RMS-over-Frequencies Stress at Point D of End A
- 4
- Bending PSDF/RMS-over-Frequencies Stress at Point E of End A
- 5
- Bending PSDF/RMS-over-Frequencies Stress at Point F of End A
- 6
- Axial Stress
- 10
- Bending PSDF/RMS-over-Frequencies Stress at Point C of End B
- 11
- Bending PSDF/RMS-over-Frequencies Stress at Point D of End B
- 12
- Bending PSDF/RMS-over-Frequencies Stress at Point E of End B
- 13
- Bending PSDF/RMS-over-Frequencies Stress at Point F of End B
Stress Results are output at ends A and B at stress recovery points C, D, E, and F. For PBAR, the stress recovery points are user-defined on the PBAR Bulk Data Entry. For PBARL, the stress recovery points are automatically defined by the beam type and dimensions.
Element PSDF Stress results are not output for CFAST, CWELD, CBUSH, CROD, and CELAS elements in the .pch file.
2D Elements
The type of stress information printed for 2D elements (CQUAD4, CQUAD8, CTRIA3, and CTRIA6) is common. However, the results format and information depends on the results location requested on the STRESS entry.
- Number
- Result Type
- 1
- 2D Element ID
- 2
- Fiber Distance (at location Z1 defined on PSHELL)
- 3
- Normal XX PSDF/RMS-over-Frequencies Stress (at location Z1 defined on PSHELL)
- 4
- Normal YY PSDF/RMS-over-Frequencies Stress (at location Z1 defined on PSHELL)
- 5
- Shear XY PSDF/RMS-over-Frequencies Stress (at location Z1 defined on PSHELL)
- 6
- Fiber Distance (at location Z2 defined on PSHELL)
- 7
- Normal XX PSDF/RMS-over-Frequencies Stress (at location Z2 defined on PSHELL)
- 8
- Normal YY PSDF/RMS-over-Frequencies Stress (at location Z2 defined on PSHELL)
- 9
- Shear XY PSDF/RMS-over-Frequencies Stress (at location Z2 defined on PSHELL)
- Number
- Result Type
- 1
- 2D Element ID
- 2
- CEN/ flag identifying that the current result block displays element center results.
- 3
- An Integer listing the number of grid points of the element at which results are output in the subsequent block after the central results.
- 4
- Fiber Distance (at location Z1 defined on PSHELL)
- 5
- Normal XX PSDF/RMS-over-Frequencies Stress (at location Z1 defined on PSHELL)
- 6
- Normal YY PSDF/RMS-over-Frequencies Stress (at location Z1 defined on PSHELL)
- 7
- Shear XY PSDF/RMS-over-Frequencies Stress (at location Z1 defined on PSHELL)
- 8
- Fiber Distance (at location Z2 defined on PSHELL)
- 9
- Normal XX PSDF/RMS-over-Frequencies Stress (at location Z2 defined on PSHELL)
- 10
- Normal YY PSDF/RMS-over-Frequencies Stress (at location Z2 defined on PSHELL)
- 11
- Shear XY PSDF/RMS-over-Frequencies Stress (at location Z2 defined on PSHELL)
- 12
- Grid Point ID at which stress results are output in the subsequent bloc
- 13
- Fiber Distance (at location Z1 defined on PSHELL)
- 14
- Normal XX PSDF/RMS-over-Frequencies Stress (at location Z1 defined on PSHELL)
- 15
- Normal YY PSDF/RMS-over-Frequencies Stress (at location Z1 defined on PSHELL)
- 16
- Shear XY PSDF/RMS-over-Frequencies Stress (at location Z1 defined on PSHELL)
- 17
- Fiber Distance (at location Z2 defined on PSHELL)
- 18
- Normal XX PSDF/RMS-over-Frequencies Stress (at location Z2 defined on PSHELL)
- 19
- Normal YY PSDF/RMS-over-Frequencies Stress (at location Z2 defined on PSHELL)
- 20
- Shear XY PSDF/RMS-over-Frequencies Stress (at location Z2 defined on PSHELL)
- 21
- Items 12 to 20 are repeated in sequence for all grid points of the element ID mentioned in item 1. The number of grid points for each element is mentioned in item 3.
GAUSS results are currently not supported for PCH output.
3D Elements
The type and formatting of stress information printed for 3D elements (CHEXA, CTETRA, and CPENTA) is common. The order of information printed in the .pch file is:
- Number
- Result Type
- 1
- 3D Element ID
- 2
- Placeholder negative integer (-1).
- 3
- GRID flag
- 4
- Number of Grids at which results are output for the element mentioned in item 1 (set to 0 if only element center results are requested)
- 5
- CENTER flag indicating that element center results are output in the following block.
- 6
- Normal XX PSDF/RMS-over-Frequencies Stress
- 7
- Normal YY PSDF/RMS-over-Frequencies Stress
- 8
- Normal ZZ PSDF/RMS-over-Frequencies Stress
- 9
- Shear XY PSDF/RMS-over-Frequencies Stress
- 10
- Shear YZ PSDF/RMS-over-Frequencies Stress
- 11
- Shear ZX PSDF/RMS-over-Frequencies Stress
- 12
- Grid ID indicating that stress results in the subsequent block are output at the specified Grid.
- 13
- Normal XX PSDF/RMS-over-Frequencies Stress
- 14
- Normal YY PSDF/RMS-over-Frequencies Stress
- 15
- Normal ZZ PSDF/RMS-over-Frequencies Stress
- 16
- Shear XY PSDF/RMS-over-Frequencies Stress
- 17
- Shear YZ PSDF/RMS-over-Frequencies Stress
- 18
- Shear ZX PSDF/RMS-over-Frequencies Stress
- 19
- Items 12 to 18 are repeated in sequence for all grid points of the element ID mentioned in item 1. The number of grid points for each element is mentioned in item 3.
GAUSS results are currently not supported for PCH output.
Linear Transient Response Analysis
The supported Stress output parameters for Linear Transient Response Analysis.
For Stress results output is presented in the following format. The format for elemental results such as stress is dependent on the element type. Therefore, the following sections illustrate the format and stress entities for each element type.
1D Elements
Linear Transient response stress results may be output in either SORT1 or SORT2 formats. The following information is presented in SORT2 format (which is the default for Transient analysis).
CBEAM
- Number
- Result Type
- 1
- Time step
- 2
- CBEAM Grid ID
- 3
- Station/Location Distance along the beam where stress is output
- 4
- Longitudinal Stress at Point C
- 5
- Longitudinal Stress at Point D
- 6
- Longitudinal Stress at Point E
- 7
- Longitudinal Stress at Point F
- 8
- Maximum Stress
- 9
- Minimum Stress
- 10
- Safety Margin in Tension
- 11
- Safety Margin in Compression
- 12
- The above result block is repeated for all intermediate stations and the other end of the beam. Currently intermediate stations are not supported and are output as 0.0.
Stress Results are output at ends A and B at stress recovery points C, D, E, and F. For PBEAM, the stress recovery points are user-defined on the PBEAM Bulk Data Entry. For PBEAML, the stress recovery points are automatically defined by the beam type and dimensions. Stress recovery at intermediate stations along the CBEAM element is currently not supported.
CBAR
- Number
- Result Type
- 1
- Time Step
- 2
- Bending Stress at Point C of End A
- 3
- Bending Stress at Point D of End A
- 4
- Bending Stress at Point E of End A
- 5
- Bending Stress at Point F of End A
- 6
- Axial Stress
- 7
- Maximum Stress at End A
- 8
- Minimum Stress at End A
- 9
- Safety Margin in Tension
- 10
- Bending Stress at Point C of End B
- 11
- Bending Stress at Point D of End B
- 12
- Bending Stress at Point E of End B
- 13
- Bending Stress at Point F of End B
- 14
- Maximum Stress at End B
- 15
- Minimum Stress at End B
- 16
- Safety Margin in Compression
Stress Results are output at ends A and B at stress recovery points C, D, E, and F. For PBAR, the stress recovery points are user-defined on the PBAR Bulk Data Entry. For PBARL, the stress recovery points are automatically defined by the beam type and dimensions.
CELAS
- Number
- Result Type
- 1
- Time step
- 2
- Stress along component listed on CELAS entry
CROD
- Number
- Result Type
- 1
- Time Step
- 2
- Axial Stress
- 3
- Axial Stress Safety Margin
- 4
- Torsional Stress
- 5
- Torsional Stress Safety Margin
CTUBE element results are listed as CROD results in the .pch file.
CBUSH
- Number
- Result Type
- 1
- Time step
- 2
- Stress Translational X
- 3
- Stress Translational Y
- 4
- Stress Translational Z
- 5
- Stress Moment X
- 6
- Stress Moment Y
- 7
- Stress Moment Z
Element Stress results are not output for CFAST elements in the .pch file.
2D Elements
The type of stress information printed for 2D elements (CQUAD4, CQUAD8, CTRIA3, and CTRIA6) is common. However, the results format and information depends on the results location requested on the STRESS entry.
- Number
- Result Type
- 1
- Time step
- 2
- Fiber Distance (at location Z1 defined on PSHELL)
- 3
- Normal XX Stress (at location Z1 defined on PSHELL)
- 4
- Normal YY Stress (at location Z1 defined on PSHELL)
- 5
- Shear XY Stress (at location Z1 defined on PSHELL)
- 6
- Principal Stress Angle (at location Z1 defined on PSHELL)
- 7
- Major Principal Stress (at location Z1 defined on PSHELL)
- 8
- Minor Principal Stress (at location Z1 defined on PSHELL)
- 9
- von Mises Stress (at location Z1 defined on PSHELL)
- 10
- Fiber Distance (at location Z2 defined on PSHELL)
- 11
- Normal XX Stress (at location Z2 defined on PSHELL)
- 12
- Normal YY Stress (at location Z2 defined on PSHELL)
- 13
- Shear XY Stress (at location Z2 defined on PSHELL)
- 14
- Principal Stress Angle (at location Z2 defined on PSHELL)
- 15
- Major Principal Stress (at location Z2 defined on PSHELL)
- 16
- Minor Principal Stress (at location Z2 defined on PSHELL)
- 17
- von Mises Stress (at location Z2 defined on PSHELL)
- Number
- Result Type
- 1
- Time step
- 2
- CEN/ flag identifying that the current result block displays element center results.
- 3
- An Integer listing the number of grid points of the element at which results are output in the subsequent block after the central results.
- 4
- Fiber Distance (at location Z1 defined on PSHELL)
- 5
- Normal XX Stress (at location Z1 defined on PSHELL)
- 6
- Normal YY Stress (at location Z1 defined on PSHELL)
- 7
- Shear XY Stress (at location Z1 defined on PSHELL)
- 8
- Principal Stress Angle (at location Z1 defined on PSHELL)
- 9
- Major Principal Stress (at location Z1 defined on PSHELL)
- 10
- Minor Principal Stress (at location Z1 defined on PSHELL)
- 11
- von Mises Stress (at location Z1 defined on PSHELL)
- 12
- Fiber Distance (at location Z2 defined on PSHELL)
- 13
- Normal XX Stress (at location Z2 defined on PSHELL)
- 14
- Normal YY Stress (at location Z2 defined on PSHELL)
- 15
- Shear XY Stress (at location Z2 defined on PSHELL)
- 16
- Principal Stress Angle (at location Z2 defined on PSHELL)
- 17
- Major Principal Stress (at location Z2 defined on PSHELL)
- 18
- Minor Principal Stress (at location Z2 defined on PSHELL)
- 19
- von Mises Stress (at location Z2 defined on PSHELL)
- 20
- Grid Point ID at which stress results are output in the subsequent block.
- 21
- Fiber Distance (at location Z1 defined on PSHELL)
- 22
- Normal XX Stress (at location Z1 defined on PSHELL)
- 23
- Normal YY Stress (at location Z1 defined on PSHELL)
- 24
- Shear XY Stress (at location Z1 defined on PSHELL)
- 25
- Principal Stress Angle (at location Z1 defined on PSHELL)
- 26
- Major Principal Stress (at location Z1 defined on PSHELL)
- 27
- Minor Principal Stress (at location Z1 defined on PSHELL)
- 28
- von Mises Stress (at location Z1 defined on PSHELL)
- 29
- Fiber Distance (at location Z2 defined on PSHELL)
- 30
- Normal XX Stress (at location Z2 defined on PSHELL)
- 31
- Normal YY Stress (at location Z2 defined on PSHELL)
- 32
- Shear XY Stress (at location Z2 defined on PSHELL)
- 33
- Principal Stress Angle (at location Z2 defined on PSHELL)
- 34
- Major Principal Stress (at location Z2 defined on PSHELL)
- 35
- Minor Principal Stress (at location Z2 defined on PSHELL)
- 36
- von Mises Stress (at location Z2 defined on PSHELL)
- 37
- Items 20 to 36 are repeated in sequence for all grid points of the element ID mentioned in item 1. The number of grid points for each element is mentioned in item 3.
GAUSS results are currently not supported for PCH output.
3D Elements
The type and formatting of stress information printed for 3D elements (CHEXA, CTETRA, and CPENTA) is common. The order of information printed in the .pch file is:
- Number
- Result Type
- 1
- Time step
- 2
- Placeholder negative integer (-1).
- 3
- GRID flag
- 4
- Number of Grids at which results are output for the element mentioned in item 1 (set to 0 if only element center results are requested)
- 5
- CENTER flag indicating that element center results are output in the following block.
- 6
- Normal XX Stress
- 7
- Shear XY Stress
- 8
- Major Principal Stress
- 9
- Major Principal X Cosine
- 10
- Mid Principal X Cosine
- 11
- Minor Principal X Cosine
- 12
- Mean Stress
- 13
- von Mises Stress
- 14
- Normal YY Stress
- 15
- Shear YZ Stress
- 16
- Mid Principal Stress
- 17
- Major Principal Y Cosine
- 18
- Mid Principal Y Cosine
- 19
- Minor Principal Y Cosine
- 20
- Normal ZZ Stress
- 21
- Shear XZ Stress
- 22
- Minor Principal Stress
- 23
- Major Principal Z Cosine
- 24
- Mid Principal Z Cosine
- 25
- Minor Principal Z Cosine
- 26
- Grid ID indicating that stress results in the subsequent block are output at the specified Grid.
- 27
- Normal XX Stress
- 28
- Shear XY Stress
- 29
- Major Principal Stress
- 30
- Major Principal X Cosine
- 31
- Mid Principal X Cosine
- 32
- Minor Principal X Cosine
- 33
- Mean Stress
- 34
- von Mises Stress
- 35
- Normal YY Stress
- 36
- Shear YZ Stress
- 37
- Mid Principal Stress
- 38
- Major Principal Y Cosine
- 39
- Mid Principal Y Cosine
- 40
- Minor Principal Y Cosine
- 41
- Normal ZZ Stress
- 42
- Shear XZ Stress
- 43
- Minor Principal Stress
- 44
- Major Principal Z Cosine
- 45
- Mid Principal Z Cosine
- 46
- Minor Principal Z Cosine
- 47
- Items 26 to 46 are repeated in sequence for all grid points of the element ID mentioned in item 1. The number of grid points for each element is mentioned in item 3.
GAUSS results are currently not supported for PCH output.
Linear and Nonlinear Static Analysis
The supported Stress output parameters for Linear Static Analysis.
For Stress results the output is presented in the following format. The format for elemental results such as stress is dependent on the element type. Therefore, the following sections illustrate the format and stress entities for each element type.
1D Elements - CBEAM
- Number
- Result Type
- 1
- CBEAM Grid ID
- 2
- Station/Location Distance along the beam where stress is output
- 3
- Longitudinal Stress at Point C
- 4
- Longitudinal Stress at Point D
- 5
- Longitudinal Stress at Point E
- 6
- Longitudinal Stress at Point F
- 7
- Maximum Stress
- 8
- Minimum Stress
- 9
- Safety Margin in Tension
- 10
- Safety Margin in Compression
- 11
- The above result block is repeated for all intermediate stations and the other end of the beam. Currently intermediate stations are not supported and are output as 0.0.
Stress Results are output at ends A and B at stress recovery points C, D, E, and F. For PBEAM, the stress recovery points are user-defined on the PBEAM Bulk Data Entry. For PBEAML, the stress recovery points are automatically defined by the beam type and dimensions. Stress recovery at intermediate stations along the CBEAM element is currently not supported.
CBAR
- Number
- Result Type
- 1
- CBAR Element ID
- 2
- Bending Stress at Point C of End A
- 3
- Bending Stress at Point D of End A
- 4
- Bending Stress at Point E of End A
- 5
- Bending Stress at Point F of End A
- 6
- Axial Stress
- 7
- Maximum Stress at End A
- 8
- Minimum Stress at End A
- 9
- Safety Margin in Tension
- 10
- Bending Stress at Point C of End B
- 11
- Bending Stress at Point D of End B
- 12
- Bending Stress at Point E of End B
- 13
- Bending Stress at Point F of End B
- 14
- Maximum Stress at End B
- 15
- Minimum Stress at End B
- 16
- Safety Margin in Compression
Stress Results are output at ends A and B at stress recovery points C, D, E, and F. For PBAR, the stress recovery points are user-defined on the PBAR Bulk Data Entry. For PBARL, the stress recovery points are automatically defined by the beam type and dimensions.
CELAS
- Number
- Result Type
- 1
- CELAS Element ID
- 2
- Stress along component listed on CELAS entry
CROD
- Number
- Result Type
- 1
- CROD Element ID
- 2
- Axial Stress
- 3
- Axial Stress Safety Margin
- 4
- Torsional Stress
- 5
- Torsional Stress Safety Margin
CTUBE element results are listed as CROD results in the .pch file.
CWELD
- Number
- Result Type
- 1
- CWELD Element ID
- 2
- Axial Stress
- 3
- Maximum Stress at End A
- 4
- Minimum Stress at End A
- 5
- Maximum Stress at End B
- 6
- Minimum Stress at End B
- 7
- Maximum Shear Stress
- 8
- Bearing Stress
CBUSH
- Number
- Result Type
- 1
- CBUSH Element ID
- 2
- Stress Translational X
- 3
- Stress Translational Y
- 4
- Stress Translational Z
- 5
- Stress Moment X
- 6
- Stress Moment Y
- 7
- Stress Moment Z
Element Stress results are not output for CFAST elements in the .pch file.
2D Elements
The type of stress information printed for 2D elements (CQUAD4, CQUAD8, CTRIA3, and CTRIA6) is common. However, the results format and information depends on the results location requested on the STRESS entry.
- Number
- Result Type
- 1
- 2D Element ID
- 2
- Fiber Distance (at location Z1 defined on PSHELL)
- 3
- Normal XX Stress (at location Z1 defined on PSHELL)
- 4
- Normal YY Stress (at location Z1 defined on PSHELL)
- 5
- Shear XY Stress (at location Z1 defined on PSHELL)
- 6
- Principal Stress Angle (at location Z1 defined on PSHELL)
- 7
- Major Principal Stress (at location Z1 defined on PSHELL)
- 8
- Minor Principal Stress (at location Z1 defined on PSHELL)
- 9
- von Mises Stress (at location Z1 defined on PSHELL)
- 10
- Fiber Distance (at location Z2 defined on PSHELL)
- 11
- Normal XX Stress (at location Z2 defined on PSHELL)
- 12
- Normal YY Stress (at location Z2 defined on PSHELL)
- 13
- Shear XY Stress (at location Z2 defined on PSHELL)
- 14
- Principal Stress Angle (at location Z2 defined on PSHELL)
- 15
- Major Principal Stress (at location Z2 defined on PSHELL)
- 16
- Minor Principal Stress (at location Z2 defined on PSHELL)
- 17
- von Mises Stress (at location Z2 defined on PSHELL)
- Number
- Result Type
- 1
- 2D Element ID
- 2
- CEN/ flag identifying that the current result block displays element center results.
- 3
- An Integer listing the number of grid points of the element at which results are output in the subsequent block after the central results.
- 4
- Fiber Distance (at location Z1 defined on PSHELL)
- 5
- Normal XX Stress (at location Z1 defined on PSHELL)
- 6
- Normal YY Stress (at location Z1 defined on PSHELL)
- 7
- Shear XY Stress (at location Z1 defined on PSHELL)
- 8
- Principal Stress Angle (at location Z1 defined on PSHELL)
- 9
- Major Principal Stress (at location Z1 defined on PSHELL)
- 10
- Minor Principal Stress (at location Z1 defined on PSHELL)
- 11
- von Mises Stress (at location Z1 defined on PSHELL)
- 12
- Fiber Distance (at location Z2 defined on PSHELL)
- 13
- Normal XX Stress (at location Z2 defined on PSHELL)
- 14
- Normal YY Stress (at location Z2 defined on PSHELL)
- 15
- Shear XY Stress (at location Z2 defined on PSHELL)
- 16
- Principal Stress Angle (at location Z2 defined on PSHELL)
- 17
- Major Principal Stress (at location Z2 defined on PSHELL)
- 18
- Minor Principal Stress (at location Z2 defined on PSHELL)
- 19
- von Mises Stress (at location Z2 defined on PSHELL)
- 20
- Grid Point ID at which stress results are output in the subsequent block.
- 21
- Fiber Distance (at location Z1 defined on PSHELL)
- 22
- Normal XX Stress (at location Z1 defined on PSHELL)
- 23
- Normal YY Stress (at location Z1 defined on PSHELL)
- 24
- Shear XY Stress (at location Z1 defined on PSHELL)
- 25
- Principal Stress Angle (at location Z1 defined on PSHELL)
- 26
- Major Principal Stress (at location Z1 defined on PSHELL)
- 27
- Minor Principal Stress (at location Z1 defined on PSHELL)
- 28
- von Mises Stress (at location Z1 defined on PSHELL)
- 29
- Fiber Distance (at location Z2 defined on PSHELL)
- 30
- Normal XX Stress (at location Z2 defined on PSHELL)
- 31
- Normal YY Stress (at location Z2 defined on PSHELL)
- 32
- Shear XY Stress (at location Z2 defined on PSHELL)
- 33
- Principal Stress Angle (at location Z2 defined on PSHELL)
- 34
- Major Principal Stress (at location Z2 defined on PSHELL)
- 35
- Minor Principal Stress (at location Z2 defined on PSHELL)
- 36
- von Mises Stress (at location Z2 defined on PSHELL)
- 37
- Items 20 to 36 are repeated in sequence for all grid points of the element ID mentioned in item 1. The number of grid points for each element is mentioned in item 3.
GAUSS results are currently not supported for PCH output.
3D Elements
The type and formatting of stress information printed for 3D elements (CHEXA, CTETRA, and CPENTA) is common. The order of information printed in the .pch file is:
- Number
- Result Type
- 1
- 3D Element ID
- 2
- Placeholder negative integer (-1).
- 3
- GRID flag
- 4
- Number of Grids at which results are output for the element mentioned in item 1 (set to 0 if only element center results are requested).
- 5
- CENTER flag indicating that element center results are output in the following block.
- 6
- Normal XX Stress
- 7
- Shear XY Stress
- 8
- Major Principal Stress
- 9
- Major Principal X Cosine
- 10
- Mid Principal X Cosine
- 11
- Minor Principal X Cosine
- 12
- Mean Stress
- 13
- von Mises Stress
- 14
- Normal YY Stress
- 15
- Shear YZ Stress
- 16
- Mid Principal Stress
- 17
- Major Principal Y Cosine
- 18
- Mid Principal Y Cosine
- 19
- Minor Principal Y Cosine
- 20
- Normal ZZ Stress
- 21
- Shear XZ Stress
- 22
- Minor Principal Stress
- 23
- Major Principal Z Cosine
- 24
- Mid Principal Z Cosine
- 25
- Minor Principal Z Cosine
- 26
- Grid ID indicating that stress results in the subsequent block are output at the specified Grid.
- 27
- Normal XX Stress
- 28
- Shear XY Stress
- 29
- Major Principal Stress
- 30
- Major Principal X Cosine
- 31
- Mid Principal X Cosine
- 32
- Minor Principal X Cosine
- 33
- Mean Stress
- 34
- von Mises Stress
- 35
- Normal YY Stress
- 36
- Shear YZ Stress
- 37
- Mid Principal Stress
- 38
- Major Principal Y Cosine
- 39
- Mid Principal Y Cosine
- 40
- Minor Principal Y Cosine
- 41
- Normal ZZ Stress
- 42
- Shear XZ Stress
- 43
- Minor Principal Stress
- 44
- Major Principal Z Cosine
- 45
- Mid Principal Z Cosine
- 46
- Minor Principal Z Cosine
- 47
- Items 26 to 46 are repeated in sequence for all grid points of the element ID mentioned in item 1. The number of grid points for each element is mentioned in item 3.
GAUSS results are currently not supported for PCH output.
Velocity
The Nastran Punch (PCH) format file contains various supported output across multiple solution sequences.
The output request initiation and corresponding parameters are controlled by the VELOCITY I/O Options Entry and Subcase Information Entry.
- Solution Sequence
- Requested corresponding output parameters
This document contains details about PCH output for various solution sequences, with corresponding output parameters (wherever applicable). Example: PCH output from actual models are illustrated with information about the various sections of the output.
Similar PCH format documents are available for all supported output variables (STRESS, STRAIN, and so on). See the .pch file for a full list of supported output variables in conjunction with PCH output format, along with a link to each detailed PCH format documents.
General Velocity PCH Format (File Specification)
The information in the PCH file varies depending on the requested output, however, some parts of the PCH file are common and the syntax is similar to most output data.
The PCH file consists of data blocks, each containing corresponding information for the listed Subcase or the subsequent subset data (for example, eigenvalue or time step).
Each data block is printed with the following format.
Line 1 - $TITLE = This represents the Solver Name (OptiStruct) and the version Number (for example,
14.0.220).
Line 2 - $SUBTITLE =
Line 3 - $LABEL = This is the label of the Current Subcase (this is
input in the model)
Line 4 - $<result type> = This represents the type of results
being printed in this data block.
Line 5 - $SUBCASE ID = This represents the ID of the subcase for
which the results are printed in this data block. The $LABEL field
in line 3 corresponds to this subcase.
Frequency Response Analysis
The supported Velocity output parameters for Frequency Response Analysis.
General (Default)

Figure 26.
Sorted Output

Figure 27. SORT2 Argument Sorts Results Wherein Grid/Elements are Grouped Together
Output Form (form)

Figure 28. PHASE Argument Provides Output in the Polar Format
Filtered Output (peakoutput)
Output can be filtered based on the loading frequencies at which specified result peaks occur. This can be controlled on the PEAKOUT Bulk Data Entry. The format for the PCH output is the same as those shown in previous sections. The output is just a smaller subset of loading frequencies.
Normal Velocity (type)
Normal velocity results for grid points on the surface of shell and solid elements are output. The NORMAL argument can be used to generate this output. Currently NORMAL velocity results are not available in the PCH file.
Random Response Analysis
The supported Velocity output parameters for Random Response Analysis.
General (Default) or Random Output (random)

Figure 29.
Linear Transient Analysis
The supported Velocity output parameters for Linear Transient Analysis.
General (Default)
Figure 30.
Sorted Output
Figure 31.
Linear Transient Analysis by Fourier Transformation
The supported Velocity output parameters for Linear Transient Analysis by Fourier Transformation.
General (Default)
For Velocity results with the default settings, for example if VELOCITY(PUNCH)=ALL/SID is used, the output is presented in the same format as Linear Transient Analysis.
Force
The Nastran Punch (PCH) format file contains various supported output across multiple solution sequences.
The output request initiation and corresponding parameters are controlled by the ELEMENT FORCE I/O Options and Subcase Information Entry.
- Solution Sequence
- Requested corresponding output parameters
- Element Type
This document contains details about PCH output for various solution sequences, with corresponding output parameters (wherever applicable). Example: PCH output from actual models are illustrated with information about the various sections of the output.
Similar PCH format documents are available for all supported output variables (STRESS, STRAIN, and so on). See the .pch file for a full list of supported output variables in conjunction with PCH output format, along with a link to each detailed PCH format documents.
General Element Force PCH Format (File Specification)
The information in the PCH file varies depending on the requested output, however, some parts of the PCH file are common and the syntax is similar to most output data.
The PCH file consists of data blocks, each containing corresponding information for the listed Subcase or the subsequent subset data (for example, eigenvalue or time step).
Each data block is printed with the following format.
Line 1 - $TITLE = This represents the Solver Name (OptiStruct) and the version Number (for example,
14.0.220).
Line 2 - $SUBTITLE =
Line 3 - $LABEL = This is the label of the Current Subcase (this is
input in the model)
Line 4 - $<result type> = This represents the type of results
being printed in this data block.
Line 5 - $SUBCASE ID = This represents the ID of the subcase for
which the results are printed in this data block. The $LABEL field
in line 3 corresponds to this subcase.
Frequency Response Analysis
The supported Element Force output parameters for Frequency Response Analysis.
For Element Force results, the output is presented in the following format. The format for elemental results as the force is dependent on the element type. Therefore, the format and element force entities for each element type are illustrated. The CONT term indicates that the result for the specified element continues in the subsequent line.
General (Default)
1D Elements

Figure 32. CBEAM
- Number
- Result Type
- 1
- 1D Element ID
- 2
- Grid ID A
- 3
- Station A Dist/Length = 0.0
- 4
- Bending Plane-1 A (Real)
- 5
- Bending Plane-2 A (Real)
- 6
- Shear Plane-1 A (Real)
- 7
- Shear Plane-2 A (Real)
- 8
- Axial Force A (Real)
- 9
- Torque A (Real)
- 10
- Warping Torque A (Real)
- 11
- Bending Plane-1 A (Imag)
- 12
- Bending Plane-2 A (Imag)
- 13
- Shear Plane-1 A (Imag)
- 14
- Shear Plane-2 A (Imag)
- 15
- Axial Force A (Imag)
- 16
- Torque A (Imag)
- 17
- Warping Torque A (Imag)
- 18-161
- Dummy ZERO values (for K=2…10 stations)
- 162
- Grid ID B
- 163
- Station A Dist/Length = 1.00
- 164
- Bending Plane-1 B (Real)
- 165
- Bending Plane-2 B (Real)
- 166
- Shear Plane-1 B (Real)
- 167
- Shear Plane-2 B (Real)
- 168
- Axial Force B (Real)
- 169
- Torque B (Real)
- 170
- Warping Torque (Real)
- 171
- Bending Plane-1 B (Imag)
- 172
- Bending Plane-2 B (Imag)
- 173
- Shear Plane-1 B (Imag)
- 174
- Shear Plane-2 B (Imag)
- 175
- Axial Force B (Imag)
- 176
- Torque B (Imag)
- 177
- Warping Torque B (Imag)

Figure 33. CBAR
- Number
- Result Type
- 1
- 1D Element ID
- 2
- Bending Plane-1 A ( Real)
- 3
- Bending Plane-2 A (Real)
- 4
- Bending Plane-1 B (Real)
- 5
- Bending Plane-2 B (Real)
- 6
- Shear Plane 1 (Average) (Real)
- 7
- Shear Plane 2 (Average) (Real)
- 8
- Axial Force (Average) (Real)
- 9
- Torque (Average) (Real)
- 10
- Bending Plane-1 A (Imag)
- 11
- Bending Plane-2 A (Imag)
- 12
- Bending Plane-1 B (Imag)
- 13
- Bending Plane-2 B (Imag)
- 14
- Shear Plane 1 (Average) (Imag)
- 15
- Shear Plane 2 (Average) (Imag)
- 16
- CBAR Axial Force (Average) (Imag)
- 17
- Torque (Average) (Imag)

Figure 34. CWELD
- Number
- Result Type
- 1
- 1D Element ID
- 2
- MZ Bending end A Plane-1 (Real)
- 3
- MY Bending end A Plane-2 (Real)
- 4
- MZ Bending end B Plane-1 (Real)
- 5
- MY Bending end B Plane-2 (Real)
- 6
- FY Shear Force Plane 1 (Average) (Real)
- 7
- FZ Shear Force Plane 2 (Average) (Real)
- 8
- FX Axial Force (Average) (Real)
- 9
- MX Torque (Average) (Real)
- 10
- MZ Bending end A Plane-1 (Imag)
- 11
- MY Bending end A Plane-2 (Imag)
- 12
- MZ Bending end B Plane-1 (Imag)
- 13
- MY Bending end B Plane-2 (Imag)
- 14
- FY Shear Force Plane 1 (Average) (Imag)
- 15
- FZ Shear Force Plane 2 (Average) (Imag)
- 16
- FX Axial Force (Average) (Imag)
- 17
- MX Torque (Average) (Imag)

Figure 35. CGAP
- Number
- Result Type
- 1
- 1D Element ID
- 2
- Compression Force in X (Real)
- 3
- Shear Force in Y (Real)
- 4
- Shear Force in Z (Real)
- 5
- Axial Displacement in X (Real)
- 6
- Shear Displacement in Y (Real)
- 7
- Shear Displacement in Z (Real)
- 8
- Slip Displacement in Y (Unsupported) (Real)
- 9
- Slip Displacement in Y (Unsupported) (Real)
- 10
- Compression Force in X (Imag)
- 11
- Shear Force in Y (Imag)
- 12
- Shear Force in Z (Imag)
- 13
- Axial Displacement in X (Imag)
- 14
- Shear Displacement in Y (Imag)
- 15
- Shear Displacement in Z (Imag)
- 16
- Slip Displacement in Y (Unsupported) (Imag)
- 17
- Slip Displacement in Y (Unsupported) (Imag)

Figure 36. CROD
- Number
- Result Type
- 1
- CROD Element ID
- 2
- Element Force (Real)
- 3
- Element Moment (Real)
- 4
- Element Force (Imag)
- 5
- Element Moment (Imag)

Figure 37. CELAS1
- Number
- Result Type
- 1
- CELAS Element ID
- 2
- Element Force (Real)
- 3
- Element Force (Imag)

Figure 38. CBUSH
- Number
- Result Type
- 1
- CBUSH Element ID
- 2
- Element Force X (Real)
- 3
- Element Force Y (Real)
- 4
- Element Force Z (Real)
- 5
- Element Moment X (Real)
- 6
- Element Moment Y (Real)
- 7
- Element Moment Z (Real)
- 8
- Element Force X (Imag)
- 9
- Element Force Y (Imag)
- 10
- Element Force Z (Imag)
- 11
- Element Moment X (Imag)
- 12
- Element Moment Y (Imag)
- 13
- Element Moment Z (Imag)

Figure 39. CDAMP1
- Number
- Result Type
- 1
- Element ID
- 2
- Element Force (Real)
- 3
- Element Force (Imag)

Figure 40. CVISC
- Number
- Result Type
- 1
- CVISC Element ID
- 2
- Element Force (Real)
- 3
- Element Force (Imag)
- 4
- Element Moment (Real)
- 5
- Element Moment (Imag)
2D Elements
The type of Force information printed for 2D elements (CQUAD4, CQUAD8, CTRIA3, and CTRIA6) is common.

Figure 41. CTRIA3

Figure 42. CTRIA6
- Number
- Result Type
- 1
- 1D Element ID
- 2
- Element Force XX (Real)
- 3
- Element Force YY (Real)
- 4
- Element Force XY (Real)
- 5
- Element Moment XX (Real)
- 6
- Element Moment YY (Real)
- 7
- Element Moment XY (Real)
- 8
- Element Force ZX (Shear x) (Real)
- 9
- Element Force YZ (Shear y) (Real)
- 10
- Element Force XX (Imag)
- 11
- Element Force YY (Imag)
- 12
- Element Force XY (Imag)
- 13
- Element Moment XX (Imag)
- 14
- Element Moment YY (Imag)
- 15
- Element Moment XY (Imag)
- 16
- Element Force ZX (Shear x) (Imag)
- 17
- Element Force YZ (Shear y) (Imag)
Sorted Output

Figure 43.
Output Form

Figure 44.
- Number
- Result Type
- 1
- Loading Frequency
- 2
- Element Force XX (Real)
- 3
- Element Force YY (Real)
- 4
- Element Force XY (Real)
- 5
- Element Moment XX (Real)
- 6
- Element Moment YY (Real)
- 7
- Element Moment XY (Real)
- 8
- Element Force ZX (Real)
- 9
- Element Force YZ (Real)
- 10
- Element Force XX (Imag)
- 11
- Element Force YY (Imag)
- 12
- Element Force XY (Imag)
- 13
- Element Moment XX (Imag)
- 14
- Element Moment YY (Imag)
- 15
- Element Moment XY (Imag)
- 16
- Element Force ZX (Imag)
- 17
- Element Force YZ (Imag)
Filtered Output (peakoutput)
Output can be filtered based on the loading frequencies at which specified result peaks occur. This can be controlled on the PEAKOUT Bulk Data Entry. The format for the PCH output is the same as those shown in previous sections. The output is just a smaller subset of loading frequencies.
Modal Output (modal)
Modal Element Force can be output for any Modal Frequency Response Subcase with the MODAL argument. It gives element force results at different modes.
1D Elements

Figure 45. CBEAM
- Number
- Result Type
- 1
- 1D Element ID
- 2
- Grid ID A
- 3
- Station A Dist/Length = 0.0
- 4
- Bending Plane-1 A (Real)
- 5
- Bending Plane-2 A (Real)
- 6
- Shear Plane-1 A (Real)
- 7
- Shear Plane-2 A (Real)
- 8
- Axial Force A (Real)
- 9
- Torque A (Real)
- 10
- Warping Torque A (Real)
- 11-91
- Dummy ZERO values (for K=2…10 stations)
- 92
- Grid ID B
- 93
- Station A Dist/Length = 1
- 94
- Bending Plane-1 B (Real)
- 95
- Bending Plane-2 B (Real)
- 96
- Shear Plane-1 B (Real)
- 97
- Shear Plane-2 B (Real)
- 98
- Axial Force B (Real)
- 99
- Torque B (Real)
- 100
- Warping Torque (Real)

Figure 46. CBAR
- Number
- Result Type
- 1
- 1D Element ID
- 2
- Bending Plane-1 A (Real)
- 3
- Bending Plane-2 A (Real)
- 4
- Bending Plane-1 B (Real)
- 5
- Bending Plane-2 B (Real)
- 6
- Shear Plane-1 (Average) (Real)
- 7
- Shear Plane-2 (Average) (Real)
- 8
- Axial Force (Average) (Real)
- 9
- Torque (Average) (Real)

Figure 47. CWELD
- Number
- Result Type
- 1
- 1D Element ID
- 2
- MZ Bending end A Plane-1 (Real)
- 3
- MY Bending end A Plane-2 (Real)
- 4
- MZ Bending end B Plane-1 (Real)
- 5
- MY Bending end B Plane-2 (Real)
- 6
- FY Shear Force Plane-1 (Average) (Real)
- 7
- FZ Shear Force Plane-2 (Average) (Real)
- 8
- FX Axial Force (Average) (Real)
- 9
- MX Torque (Average) (Real)

Figure 48. CGAP
- Number
- Result Type
- 1
- 1D Element ID
- 2
- Compression Force in X (Real)
- 3
- Shear Force in Y (Real)
- 4
- Shear Force in Z (Real)
- 5
- Axial Displacement in X (Real)
- 6
- Shear Displacement in Y (Real)
- 7
- Shear Displacement in Z (Real)
- 8
- Slip Displacement in Y (Unsupported) (Real)
- 9
- Slip Displacement in Y (Unsupported) (Real)

Figure 49. CROD
- Number
- Result Type
- 1
- CROD Element ID
- 2
- Element Force (Real)
- 3
- Element Force (Real)

Figure 50. CELAS
- Number
- Result Type
- 1
- Element ID
- 2
- Element Force (Real)

Figure 51. CBUSH
- Number
- Result Type
- 1
- CBUSH Element ID
- 2
- Element Force X (Real)
- 3
- Element Force Y (Real)
- 4
- Element Force Z (Real)
- 5
- Element Moment X (Real)
- 6
- Element Moment Y (Real)
- 7
- Element Moment Z (Real)

Figure 52. CDAMP1
- Number
- Result Type
- 1
- Element ID
- 2
- Element Force (Real)

Figure 53. CVISC
- Number
- Result Type
- 1
- CVISC Element ID
- 2
- Element Force (Real)
- 3
- Element Force (Real)
2D Elements
The type of Force information printed for 2D elements in Modal output (CQUAD4, CQUAD8, CTRIA3, and CTRIA6) is common.

Figure 54.
- Number
- Result Type
- 1
- 1D Element ID
- 2
- Element Force XX (Real)
- 3
- Element Force YY (Real)
- 4
- Element Force XY (Real)
- 5
- Element Moment XX (Real)
- 6
- Element Moment YY (Real)
- 7
- Element Moment XY (Real)
- 8
- Element Force ZX (Real)
- 9
- Element Force YZ (Real)
Multipoint Constraint Force (MPCFORCE)
The Nastran Punch (PCH) format file contains various supported output across multiple solution sequences.
The output request initiation and corresponding parameters are controlled by the MPCFORCE I/O Options and Subcase Information Entry.
- Solution sequence
- Requested corresponding output parameters
This section contains details about PCH output for various Frequency Response Analysis with corresponding output parameters (wherever applicable). Example, PCH output from actual models is illustrated with information about the various sections of the output.
General MPCFORCE PCH Format (File Specification)
The information in the PCH file varies depending on the requested output, however, some parts of the PCH file are common and the syntax is similar to most output data.
The PCH file consists of data blocks, each containing corresponding information for the listed Subcase or the subsequent subset data (for example, eigenvalue or time step).
Each data block is printed with the following format.
Line 1 - $TITLE = This represents the Solver Name (OptiStruct) and the version Number (for example,
14.0.220).
Line 2 - $SUBTITLE =
Line 3 - $LABEL = This is the label of the Current Subcase (this is
input in the model)
Line 4 - $<result type> = This represents the type of results
being printed in this data block.
Line 5 - $SUBCASE ID = This represents the ID of the subcase for
which the results are printed in this data block. The $LABEL field
in line 3 corresponds to this subcase.
Frequency Response Analysis
The supported MPCFORCE output parameters for Frequency Response Analysis.
General (Default)
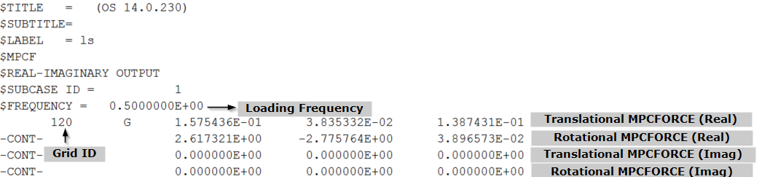
Figure 55.
- Number
- Result Type
- 1
- Grid ID at which MPCFORCE is requested
- 2
- The character “G” identifying that the results are for a particular grid
- 3
- Real part of the Translational MPCFORCE along X
- 4
- Real part of the Translational MPCFORCE along Y
- 5
- Real part of the Translational MPCFORCE along Z
- 6
- Real part of the Rotational MPCFORCE (MPC Moment) along X
- 7
- Real part of the Rotational MPCFORCE (MPC Moment) along Y
- 8
- Real part of the Rotational MPCFORCE (MPC Moment) along Z
- 9
- Imaginary part of the Translational MPCFORCE along X
- 10
- Imaginary part of the Translational MPCFORCE along Y
- 11
- Imaginary part of the Translational MPCFORCE along Z
- 12
- Imaginary part of the Rotational MPCFORCE (MPC Moment) along X
- 13
- Imaginary part of the Rotational MPCFORCE (MPC Moment) along Y
- 14
- Imaginary part of the Rotational MPCFORCE (MPC Moment) along Z
–CONT–- Indicates that the result for the specified Grid Point continues in the subsequent line.
Sorted Output
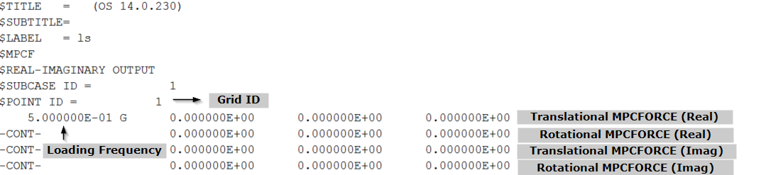
Figure 56.
- Number
- Result Type
- 1
- Grid ID at which MPCFORCE is requested
- 2
- The character “G” identifying that the results are for a particular grid
- 3
- Real part of the Translational MPCFORCE along X
- 4
- Real part of the Translational MPCFORCE along Y
- 5
- Real part of the Translational MPCFORCE along Z
- 6
- Real part of the Rotational MPCFORCE (MPC Moment) along X
- 7
- Real part of the Rotational MPCFORCE (MPC Moment) along Y
- 8
- Real part of the Rotational MPCFORCE (MPC Moment) along Z
- 9
- Imaginary part of the Translational MPCFORCE along X
- 10
- Imaginary part of the Translational MPCFORCE along Y
- 11
- Imaginary part of the Translational MPCFORCE along Z
- 12
- Imaginary part of the Rotational MPCFORCE (MPC Moment) along X
- 13
- Imaginary part of the Rotational MPCFORCE (MPC Moment) along Y
- 14
- Imaginary part of the Rotational MPCFORCE (MPC Moment) along Z
–CONT–- Indicates that the result for the specified Grid Point continues in the subsequent line.
Output Form (form)
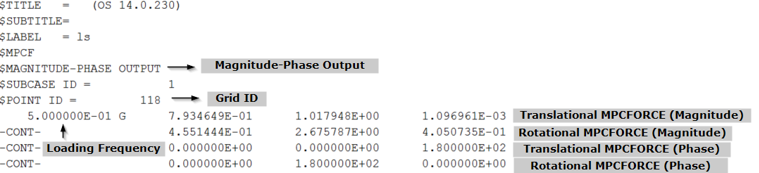
Figure 57.
- Number
- Result Type
- 1
- Grid ID at which MPCFORCE is requested
- 2
- The character “G” identifying that the results are for a particular grid
- 3
- Real part of the Translational MPCFORCE along X
- 4
- Real part of the Translational MPCFORCE along Y
- 5
- Real part of the Translational MPCFORCE along Z
- 6
- Real part of the Rotational MPCFORCE (MPC Moment) along X
- 7
- Real part of the Rotational MPCFORCE (MPC Moment) along Y
- 8
- Real part of the Rotational MPCFORCE (MPC Moment) along Z
- 9
- Imaginary part of the Translational MPCFORCE along X
- 10
- Imaginary part of the Translational MPCFORCE along Y
- 11
- Imaginary part of the Translational MPCFORCE along Z
- 12
- Imaginary part of the Rotational MPCFORCE (MPC Moment) along X
- 13
- Imaginary part of the Rotational MPCFORCE (MPC Moment) along Y
- 14
- Imaginary part of the Rotational MPCFORCE (MPC Moment) along Z
–CONT–- Indicates that the result for the specified Grid Point continues in the subsequent line.
Filtered Output (peakoutput)
Output can be filtered based on the loading frequencies at which specified result peaks occur. This can be controlled on the PEAKOUT Bulk Data Entry. The format for the PCH output is the same as those shown in previous sections. The output is just a smaller subset of loading frequencies.
Modal Output (modal)
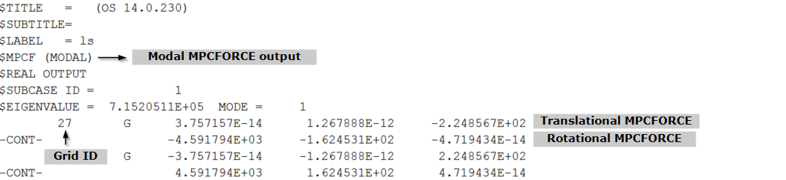
Figure 58.
Modal MPCFORCE can be defined as the Multi-Point Constraint Forces and Moments calculated based on the structural Eigenvectors and residual vectors.
- Number
- Result Type
- 1
- Grid ID at which MPCFORCE is requested
- 2
- The character “G” identifying that the results are for a particular grid
- 3
- Real part of the Translational MPCFORCE along X
- 4
- Real part of the Translational MPCFORCE along Y
- 5
- Real part of the Translational MPCFORCE along Z
- 6
- Real part of the Rotational MPCFORCE (MPC Moment) along X
- 7
- Real part of the Rotational MPCFORCE (MPC Moment) along Y
- 8
- Real part of the Rotational MPCFORCE (MPC Moment) along Z
- 9
- Imaginary part of the Translational MPCFORCE along X
- 10
- Imaginary part of the Translational MPCFORCE along Y
- 11
- Imaginary part of the Translational MPCFORCE along Z
- 12
- Imaginary part of the Rotational MPCFORCE (MPC Moment) along X
- 13
- Imaginary part of the Rotational MPCFORCE (MPC Moment) along Y
- 14
- Imaginary part of the Rotational MPCFORCE (MPC Moment) along Z
–CONT–- Indicates that the result for the specified Grid Point continues in the subsequent line.