Perform Risk Assessment
-
From the Analyze group, select the Risk
Assessment tool.
 Figure 1.
 -
Click
 to clear the existing
plot.
to clear the existing
plot.
-
Select multiple results at a time and control how these are visualized using
 .
.
- Optional:
Review the summary of all E-Lines in the model for the active loadcase and
result file by clicking
 .
If loading results from additional result files and loadcases, these will be appended to the Summary Table. The active loadcase(s) will be visible in the Bar-Plot. For easy comparison between load-cases or design iterations, select multiple and these will all be visualized.
.
If loading results from additional result files and loadcases, these will be appended to the Summary Table. The active loadcase(s) will be visible in the Bar-Plot. For easy comparison between load-cases or design iterations, select multiple and these will all be visualized. -
Click Plot to visualize results.
A summary of all E-Lines in the model for all result files and loadcases loaded in session are available for easy comparison and Report creation.
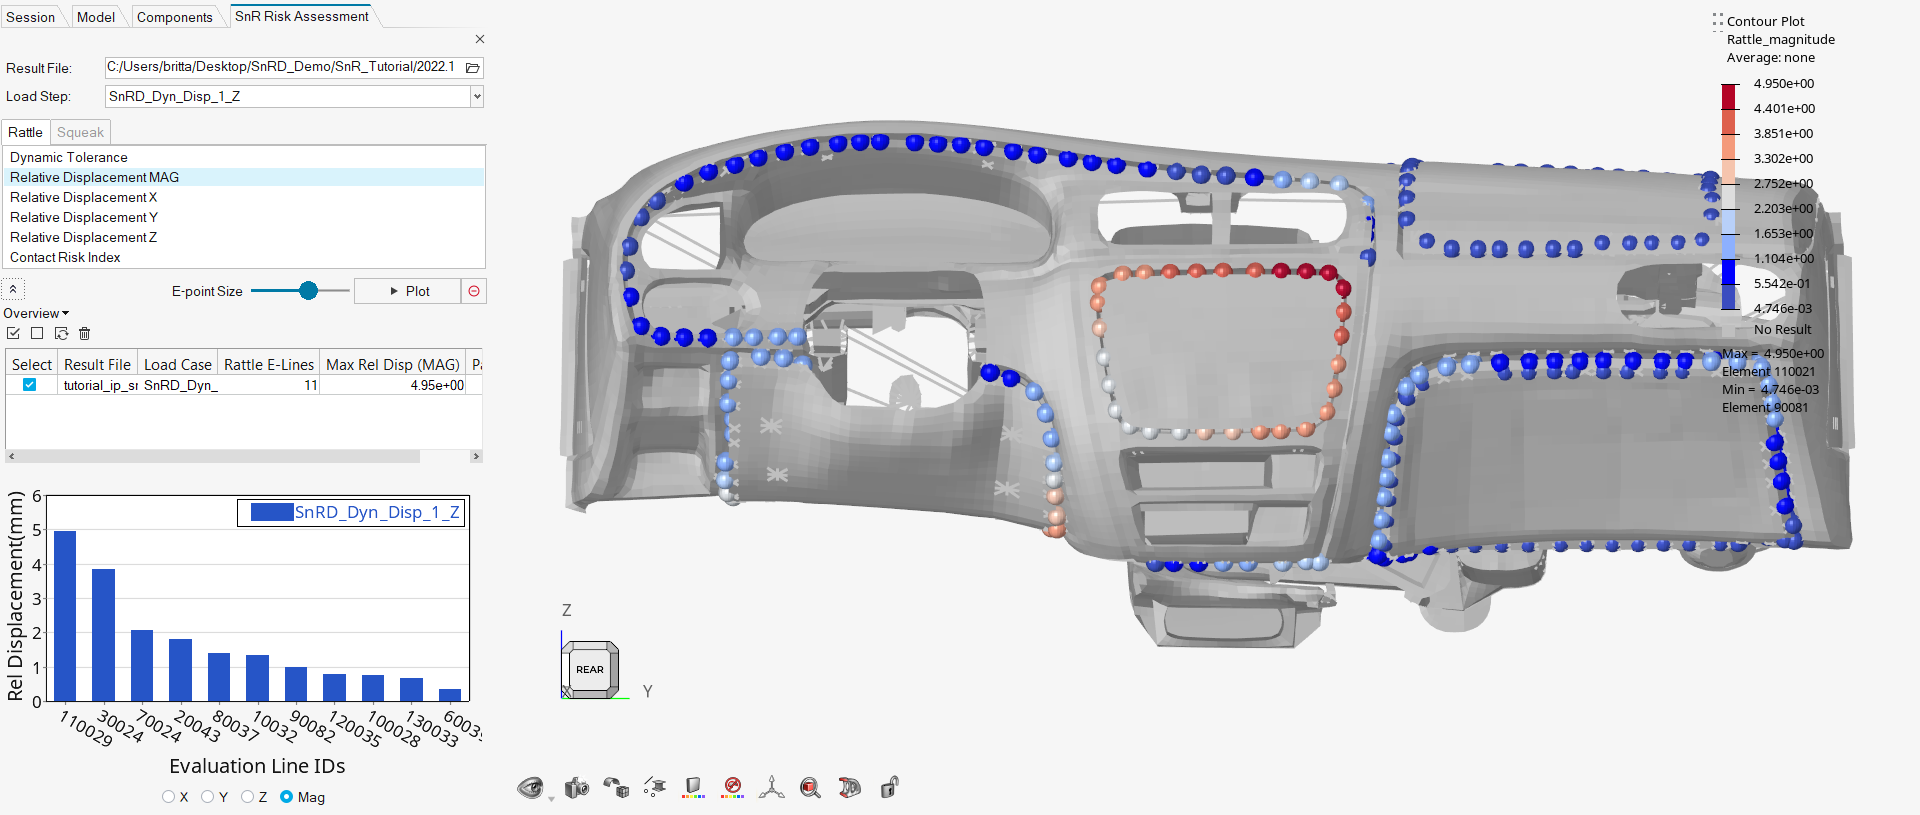 Figure 2.
 - Optional:
Review the summary of all E-Lines in the model for the
active loadcase and result file by expanding
 .
.
If you are loading results from additional result files and load cases, these will be appended to the Summary Table.
The active loadcase(s) will be visible in the Bar-Plot.
For easy comparison between load-cases or design iterations, select multiple and these are visualized.