HS-4415: Optimization Study of a Landing Beam Using Excel

Learn how to perform an optimization study in which the input variables are entered and the output responses are calculated in a Microsoft Excel spreadsheet.

Before you begin, copy the model files used in this tutorial from <hst.zip>/HS-4415/ to your working directory.

The objective is to find the cross-sectional dimensions of a tapering I- beam at its three sections that minimize the total cross-sectional area while meeting the margin of safety requirements for buckling, crippling, and combined bending and shear under ten loadcases.

The spreadsheet used here contains a page with the initial design and separate pages for crippling, buckling, and combined bending and shear calculations.

Create Matrix Input

In this step, you will create a matrix input that HyperStudy can evaluate.

  1. In Excel, open the LandingBeamCalc_Public.xls spreadsheet.
  2. Review the information, and locate the columns that contain the input variables and output responses.
    Note: When creating a Spreadsheet model for HyperStudy on a Mac or Windows platform, variable labels should only contains English characters, or a combination of English characters and numbers.

Perform the Study Setup

  1. Start HyperStudy.
  2. Start a new study in the following ways:
    • From the menu bar, click File > New.
    • On the ribbon, click .
  3. In the Add Study dialog, enter a study name, select a location for the study, and click OK.
  4. Go to the Define Models step.
  5. From the Directory, drag-and-drop the LandingBeamCalc_Public.xls file into the work area.
    The Solver input file column displays hst_input.hstp, this is the name of the solver input file HyperStudy writes during any evaluation. The Solver execution script column now displays SpreadSheet_HST.
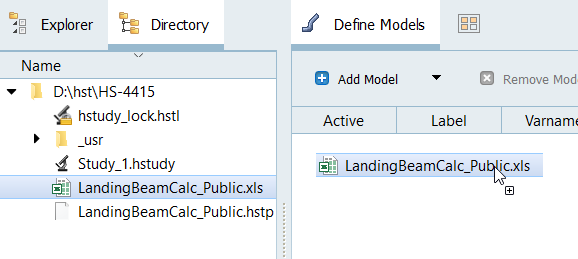

    Figure 1.
  6. Optional: If a firewall prompt dialog appears, click Allow.
  7. Click Import Variables.
    The LandingBeamCalc_Public.xls spreadsheet opens.
  8. Go to the Define Input Variables step.
  9. Add input variables.
    1. In the Excel dialog, click Yes to begin selecting input variables.
    2. In the spreadsheet, select the cells AA_w1, AA_w2, and AA_w3 in Section AA, along with their corresponding values.
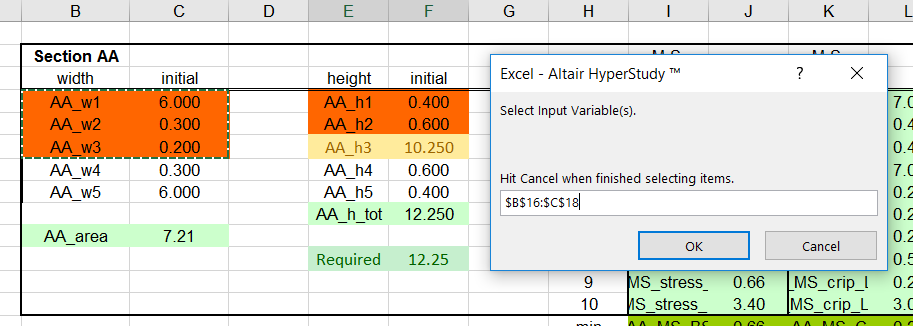

      Figure 2.
    3. In the Excel - HyperStudy Input Selector dialog, click OK.
    4. Select the following:
      • Section AA: AA_h1 and AA_h2
      • Section CC: CC_w1, CC_w2, CC_w3
      • Section CC: CC_h1, CC_h2
      • Section EE: EE_w1, EE_w2, EE_w3
      • Section EE: EE_h1, EE_h2
    5. Click Cancel to stop selecting input variables from the spreadsheet.
  10. Add output responses.
    1. In the Excel dialog, click Yes to begin selecting output responses.
    2. In the spreadsheet, select the cell AA_MS_BS in Section AA, along with its corresponding value.
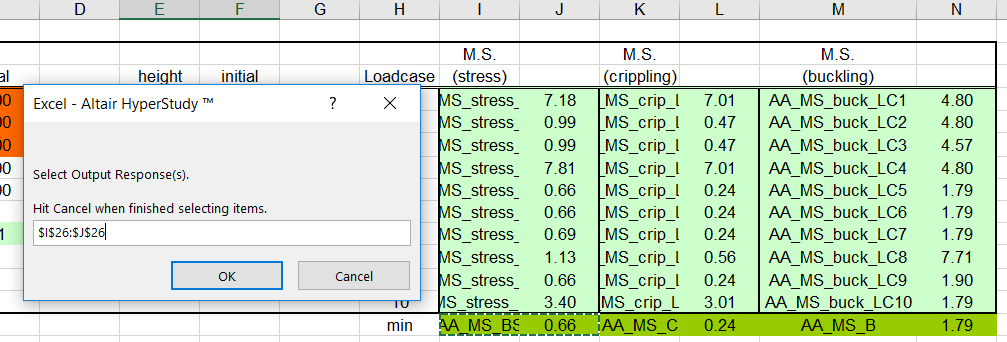

      Figure 3.
    3. In the Excel - HyperStudy Output Selector dialog, click OK.
    4. Select the following:
      • Section AA: AA_MS_C
      • Section AA: AA_MS_B
      • Section CC: CC_MS_BS
      • Section CC: CC_MS_C
      • Section CC: CC_MS_B
      • Section EE: EE_MS_BS
      • Section EE: EE_MS_C
      • Section EE: EE_MS_B
      • Area ACE value (cell C10)
    5. Click Cancel to stop selecting output responses from the spreadsheet.
      Fifteen input variables and ten output responses are imported from the LandingBeamCalc_Public.xls spreadsheet.

Perform Nominal Run

  1. Go to the Test Models step.
  2. Click Run Definition.
    An approaches/setup_1-def/ directory is created inside the study Directory. The approaches/setup_1-def/run__00001/m_1 directory contains the input file, which is the result of the nominal run.

Run Optimization

  1. Add an Optimization.
    1. In the Explorer, right-click and select Add from the context menu.
    2. In the Add dialog, select Optimization and click OK.
  2. Go to the Optimization > Definition > Define Output Responses step.
  3. Click the Objectives/Constraints - Goals tab.
  4. Apply an objective on the Area ACE output response.
    1. Click Add Goal.
    2. In the Apply On column, select Area ACE (r_10).
    3. In the Type column, select Minimize.
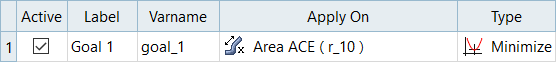

    Figure 4.
  5. Apply constraints.
    1. Click Add Goal nine times.
    2. Define Goal 2 through Goal 10 by selecting the options indicated in the Figure 5.
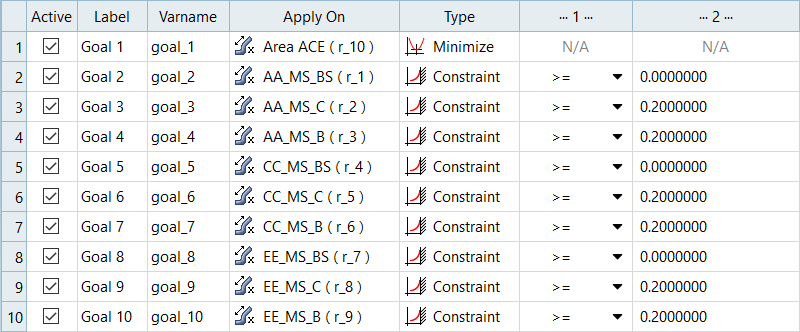

    Figure 5.
  6. Go to the Optimization > Specifications step.
  7. In the work area, set the Mode to Sequential Qadratic Programming (SQP).
  8. Click Apply.
  9. Go to the Optimization > Evaluate step.
  10. Click Evaluate Tasks.
  11. Review iteration history.
    1. Click the Iteration Plot tab to monitor the progress of the Optimization iteration.
    2. Using the Channel selector, select Goal 2 through Goal 10.
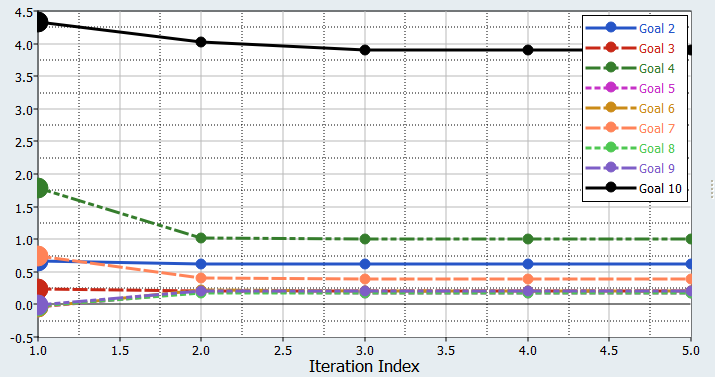

    Figure 6.