Create a Curve from a Measure
Create curves from selected measures and place them on a plot.
- 
                From the Home tools, click the Measure
                     tool.
                

Figure 1. - From the Measures panel, select a measure from the Measures list.
 - 
                Click Create Curves.
                The Create Curves dialog is displayed.
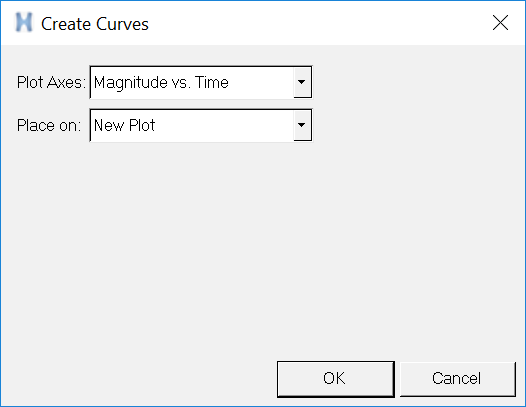
Figure 2. - 
                From the Plot Axes menu, choose the plot axes type from the following
                    options:
                
- Magnitude vs. Time
 - X vs. Time
 - Y vs. Time
 - Y vs. X
 - X vs. Y
 
 - 
                From the Place on drop-down menu, select a destination for the curve from one
                    of the following options.
                
- Preview
 - After selecting Preview, click OK. The curve is displayed in the Plot preview dialog. Click the X in the upper right corner to close the dialog.
 - New
 - After selecting New Plot, click OK. A plot is created in a HyperGraph window. The position of the plot in the window is based on the next available page layout.
 - Existing
 - Select a plot from the session tree to add the curve to the existing plot in HyperGraph. Click OK.
 
 - Click OK to create a curve with the specified placement and plot axes in aHyperGraph window, using the selected units (if specified).
 - Click Cancel to disregard the settings and exit the dialog.