OptiStruct
OptiStruct

2022

  1. Home
  2. Tutorials

    Discover OptiStruct functionality with interactive tutorials.

  3. HyperMesh Tutorials

    Tutorials using HyperMesh.

  4. Advanced Small Displacement Finite Element Analysis
  5. OS-T: 1315 Modal Transient Dynamic Analysis of a Bracket

    In this tutorial, an existing finite element model of a bracket is used to demonstrate how to perform modal transient dynamic analysis using OptiStruct. HyperGraph is used to post-process the deformation characteristics of the bracket under the transient dynamic loads.
  • What's New
  • Overview
  • Tutorials
  • User Guide
  • Reference Guide
  • Example Guide
  • Verification Problems
  • Frequently Asked Questions
Index
OptiStruct

2022

OptiStruct
  • What's New

    View new features for OptiStruct 2022.

  • Overview

    OptiStruct is a proven, modern structural solver with comprehensive, accurate and scalable solutions for linear and nonlinear analyses across statics and dynamics, vibrations, acoustics, fatigue, heat transfer, and multiphysics disciplines.

  • Tutorials

    Discover OptiStruct functionality with interactive tutorials.

    • Access the Model Files

      Learn how to access and download required model files.

    • Run OptiStruct at the Command Line
    • HyperMesh Tutorials

      Tutorials using HyperMesh.

      • Run OptiStruct from HyperMesh
      • Basic Small Displacement Finite Element Analysis
      • Advanced Small Displacement Finite Element Analysis
        • OS-T: 1300 Direct Frequency Response Analysis of a Flat Plate

          This tutorial demonstrates how to import an existing FE model, apply boundary conditions, and perform a finite element analysis on a flat plate.

        • OS-T: 1305 Modal Frequency Response Analysis of a Flat Plate

          This tutorial demonstrates how to import an existing FE model, apply boundary conditions, and perform a modal frequency response analysis on a flat plate.

        • OS-T: 1310 Direct Transient Dynamic Analysis of a Bracket

          In this tutorial, an existing finite element model of a bracket is used to demonstrate how to perform direct transient dynamic analysis using OptiStruct. HyperGraph is used to post-process the deformation characteristics of the bracket under the transient dynamic loads.

        • OS-T: 1315 Modal Transient Dynamic Analysis of a Bracket

          In this tutorial, an existing finite element model of a bracket is used to demonstrate how to perform modal transient dynamic analysis using OptiStruct. HyperGraph is used to post-process the deformation characteristics of the bracket under the transient dynamic loads.

        • OS-T: 1320 Nonlinear Gap Analysis of an Airplane Wing Rib
        • OS-T: 1325 Random Response Analysis of a Flat Plate

          This tutorial demonstrates how to set up the random response analysis for the existing frequency response analysis model. The setup for frequency response analysis is that the flat plate has two loading conditions that will be subjected to a frequency-varying load excitation using the direct method.

        • OS-T: 1330 Acoustic Analysis of a Half Car Model

          The purpose of this tutorial is to evaluate the vibration characteristics of a half car model subjected to Fluid - Structure interaction. The fluid that is being referred to is air. Essentially, the noise level or the sound level is evaluated inside the car at a location near the ear of the driver which is the main response location inside the fluid.

        • OS-T: 1340 Fatigue (Stress - Life) Method
        • OS-T: 1350 Fatigue (Strain - Life) Method
        • OS-T: 1360 NLSTAT Analysis of Gasket Materials in Contact

          This tutorial demonstrates how to carry out nonlinear implicit small displacement analysis in OptiStruct involving gasket materials and contact.

        • OS-T: 1365 NLSTAT Analysis of Solid Blocks in Contact

          This tutorial demonstrates how to carry out nonlinear implicit small displacement analysis in OptiStruct, involving elasto-plastic materials, contact and continuing the nonlinear solution sequence from a preceding nonlinear loadcase.

        • OS-T: 1370 Complex Eigenvalue Analysis of a Reduced Brake System

          In this tutorial, a modal complex eigenvalue analysis is performed on a simplified brake system to determine whether the friction effects can cause any squeal noise (unstable modes).

        • OS-T: 1371 Brake Squeal Analysis of Brake Assembly

          In this tutorial you will perform a brake squeal analysis on a brake assembly. Disc brakes are operated by applying a clamping load using a set of brake pads on the disc. The friction generated between the pads and the disc causes deceleration, and can potentially induce a dynamic instability of the system. This phenomena is known as brake squeal.

        • OS-T: 1372 Rotor Dynamics of a Hollow Cylindrical Rotor

          In this tutorial you will perform Rotor Dynamics analysis on a hollow cylindrical rotor.

        • OS-T: 1375 Response Spectrum Analysis of a Structure

          This tutorial demonstrates how to perform a Response Spectrum Analysis on a structure.

        • OS-T: 1380 Computation of Equivalent Radiated Power

          Computation of the equivalent radiated power (ERP) is a simplified method to gain information about maximum dynamic radiation of panels for excitations in frequency response analysis. This tutorial demonstrates how to set up the computation request of ERP on an existing frequency response analysis.

        • OS-T: 1385 Heat Transfer Analysis on Piston Rings using Thermal Contact

          Piston rings fit on the outer surface of a piston in an engine and they transfer heat from the piston to the cylinder wall.

        • OS-T: 1390 Pretensioned Bolt Analysis of an IC Engine Cylinder Head, Gasket and Engine Block System

          This tutorial outlines the procedure to perform both 1D and 3D pretensioned bolt analysis on a section of an IC Engine. The pretensioned analysis is conducted to measure the response of a system consisting of the cylinder head, gasket and engine block connected by four head bolts subjected to a pretension force of 4500 N each.

        • OS-T: 1392 Node-to-Surface versus Surface-to-Surface Contact

          This tutorial demonstrates how to set up contact between two parts and the impact of using choosing node-to-surface (N2S) versus surface-to-surface (S2S). In addition, this tutorial covers how to review the internally created CGAPG elements in case of N2S, and the nodes in contact in case of S2S.

        • OS-T: 1393 Basics of Contact Properties and Debugging

          This tutorial demonstrates the effect of using contact stabilization, clearance, and adjust.

        • OS-T: 1394 Axi-Symmetric Ball Joint

          This tutorial demonstrates how to carry nonlinear analysis for Axi-symmetric ball joint for pull load of 10,000N using OptiStruct.

        • OS-T: 1395 Acoustic Analysis of Speaker Using RADSND

          This tutorial demonstrates how to perform acoustic analysis of 2.1 speakers using the RADSND Method.

      • Large Displacement Finite Element Analysis
      • Fluid-Structure Interaction Analysis
      • Multibody Dynamics Analysis
      • Topology Optimization
      • Topography Optimization
      • Combination Optimization
      • Size Optimization
      • Shape Optimization
      • Fatigue Analysis
      • Nonlinear Explicit Analysis

        This section presents nonlinear explicit analysis examples generated using OptiStruct. Each example uses a problem description, execution procedures, and results to demonstrate how OptiStruct is used.

      • Aeroelastic Analysis

      • Third Party Interface

    • SimLab Tutorials

      Video tutorials using SimLab.

  • User Guide

    This manual provides detailed information regarding the features, functionality, and simulation methods available in OptiStruct.

  • Reference Guide

    This manual provides a detailed list and usage information regarding input entries, output entries, and parameters available in OptiStruct.

  • Example Guide

    The OptiStruct Example Guide is a collection of solved examples for various solution sequences and optimization types and provides you with examples of the real-world applications and capabilities of OptiStruct.

  • Verification Problems

    This manual presents solved verification models including NAFEMS problems.

  • Frequently Asked Questions

    This section provides quick responses to typical and frequently asked questions regarding OptiStruct.

View All Altair Simulation Help

OptiStruct
OptiStruct

2022

  1. Home
  2. Tutorials

    Discover OptiStruct functionality with interactive tutorials.

  3. HyperMesh Tutorials

    Tutorials using HyperMesh.

  4. Advanced Small Displacement Finite Element Analysis
  5. OS-T: 1315 Modal Transient Dynamic Analysis of a Bracket

    In this tutorial, an existing finite element model of a bracket is used to demonstrate how to perform modal transient dynamic analysis using OptiStruct. HyperGraph is used to post-process the deformation characteristics of the bracket under the transient dynamic loads.

  • What's New
  • Overview
  • Tutorials
  • User Guide
  • Reference Guide
  • Example Guide
  • Verification Problems
  • Frequently Asked Questions
Index

OS-T: 1315 Modal Transient Dynamic Analysis of a Bracket

In this tutorial, an existing finite element model of a bracket is used to demonstrate how to perform modal transient dynamic analysis using OptiStruct. HyperGraph is used to post-process the deformation characteristics of the bracket under the transient dynamic loads.


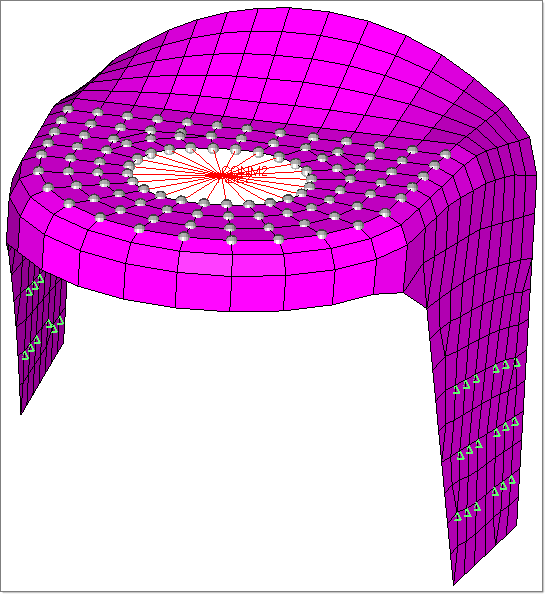
rd2030_pic1
Figure 1. Finite Element Model of the Bracket
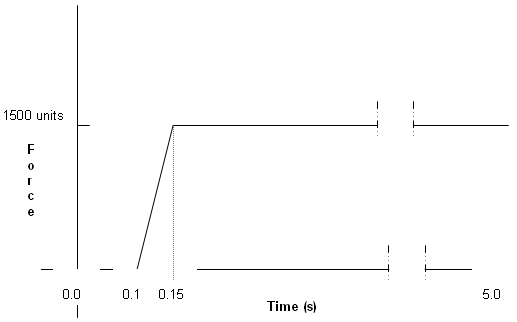
The bracket is constrained at the bottom of the two legs. Transient dynamic loads are to be applied at the grid points of the top, flat surface of the bracket around the hole in the negative z-direction. The time history of the loading is shown in Figure 2. The modal transient analysis is run for a total time of 4 seconds with the time being divided into 800 increments (that is time step is 0.005). Modal damping has been defined as 2% critical damping for all the modes. Modes up to 1000 Hz have been considered. A concentrated mass element is defined at the center of the spider and z-displacements are monitored at the concentrated mass at the center of this hole.

time_history
Figure 2. Time History of Applied Loading

Launch HyperMesh and Set the OptiStruct User Profile

  1. Launch HyperMesh.
    The User Profile dialog opens.
  2. Select OptiStruct and click OK.
    This loads the user profile. It includes the appropriate template, macro menu, and import reader, paring down the functionality of HyperMesh to what is relevant for generating models for OptiStruct.

Open the Model

  1. Click File > Open > Model.
  2. Select the bracket_transient.hm file you saved to your working directory from the optistruct.zip file. Refer to Access the Model Files.
  3. Click Open.
    The bracket_transient.hm database is loaded into the current HyperMesh session, replacing any existing data.

Set Up the Model

Create a TABLED1 Curve

  1. In the Model Browser, right-click and select Create > Curve.
  2. For Name, enter tabled1.
  3. Click Color and select a color from the color palette.
  4. For Card Image, select TABLED1 from the drop-down menu.
  5. In the Model Browser, right-click on the TABLED1 curve and select Edit.
  6. In the Curve Editor, enter the values:

    OS_1310_01
    Figure 3.
  7. Click Close.
    The load collector TABLED1 that defines the time history of the loading has been created.

Create TSTEP Load Collector

  1. In the Model Browser, right-click and select Create > Load Collector.
  2. For Name, enter tstep.
  3. Click Color and select a color from the color palette.
  4. For Card Image, select TSTEP from the drop-down menu.
  5. For TSTEP_NUM, enter 1 and press Enter.
  6. For N, enter the number of time steps as 800.
  7. For DT, enter the time increment of 0.005.
    The total time applied to the load is: 800 x 0.005 = 4 seconds. This is the time step at which output is requested. NO has a default value of 1.0.
  8. Click Close.

Create a DAREA Load Collector

  1. In the Model Browser, right-click and select Create > Load Collector.
  2. For Name, enter darea.
  3. Click Color and select a color from the color palette.
  4. For Card Image, select NONE.
  5. Click BCs > Create > Constraints to open the Constraints panel.
  6. Click nodes > by sets.
    Two sets are displayed.
  7. Select force and click select.
    The nodes that belong to the set force get selected.

    rd2030_pic3
    Figure 4.
  8. Uncheck all degrees of freedom (dof), except dof3 by clicking the box next to each, indicating that dof3 is the only active degree of freedom.
  9. For dof3, enter a value of -1500.
  10. For load types=, select DAREA.
  11. Click create.
    This creates a force of 1500 units applied to the selected nodes in the negative z direction.
  12. Click return to go back to the main menu.

Create a TABDMP1 Load Collector

  1. In the Model Browser, right-click and select Create > Load Collector.
  2. For Name, enter tabdmp1.
  3. Click Color and select a color from the color palette.
  4. For Card Image, select TABDMP1 from the drop-down list.
  5. For TABDMP1_NUM, enter a value of 2 and press Enter.
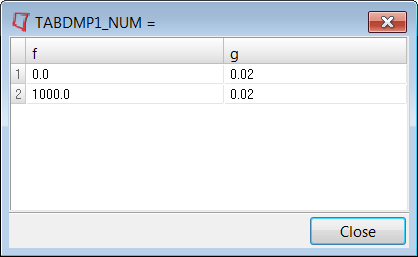
  6. Click table_pencil below TABDMP1_NUM and enter the values in the pop-out window, as shown in Figure 5.
  7. Populate the frequency and damping values for frequencies 0 and 1000 Hz and damping to be 0.02, as shown below. This provides a table of damping values for the frequency range of interest.

    OS_1315_02
    Figure 5.
  8. Click Close to return to the Entity Editor.
  9. For TYPE, switch to CRIT to specify critical damping.

Create a EIGRL Load Collector

  1. In the Model Browser, right-click and select Create > Load Collector.
  2. For Name, enter eigrl.
  3. Click Color and select a color from the color palette.
  4. For Card Image, select EIGRL from the drop-down menu.
  5. For V1, enter 0.0.
  6. For V2, enter 1000.
  7. Leave the ND field blank to extract modes up to 1000 Hz.

Create a TLOAD1 Load Collector

  1. In the Model Browser, right-click and select Create > Load Collector.
  2. For Name, enter tload1.
  3. Click Color and select a color from the color palette.
  4. For Card Image, select TLOAD1 from the drop-down list.
  5. For EXCITEID, click Unspecified > Loadcol.
  6. In the Select Loadcol dialog, select darea from the list of load collectors (created in the last section to define the forces on the top surface of the bracket).
  7. Click OK to complete the selection.
  8. Similarly select the tabled1 load collector for the TID field (to define the time history of the loading).
    The type of excitation can be an applied load (force or moment), an enforced displacement, velocity, or acceleration. The field [TYPE] in the TLOAD1 card image defines the type of load. The type is set to applied load by default.

Create a Load Step

  1. In the Model Browser, right-click and select Create > Load Step from the context menu.
    A default load step displays in the Entity Editor.
  2. For Name, enter transient.
  3. Set Analysis type type to Transient (modal).
  4. For SPC, select spc.
  5. For DLOAD, select tload1.
  6. For TSTEP(TIME), select tstep.
  7. For METHOD (STRUCT), select the load collector eigrl.
  8. For SDAMPING (STRUCT, select the load collector tabdmp1.
A subcase is created that specifies the loads, boundary conditions, and damping for modal transient dynamic analysis.

Create Output Requests

  1. From the Analysis page, click control cards.
  2. In the Card Image dialog, click GLOBAL_OUTPUT_REQUEST.
  3. Define the DISPLACEMENT card.
    1. Select DISPLACEMENT.
    2. Leave the field for FORMAT(1) blank.
    3. For FORM(1), select BOTH.
    4. For OPTION(1), select SID.
    5. Double-click the SID selector and select center.
    6. Click return.
    The center set represents the node at the center of the spider attached to the mass element, which is node 395.
  4. Define the OUTPUT card.
    1. Select OUTPUT.
    2. In the number_of_outputs= field, enter 2.
    3. For KEYWORD, select H3D and HGTRANS.
    4. For FREQ, select ALL for both.
    5. For H3D KEYWORD, set the other field to blank.
    6. Click return.
  5. Click return to exit from the dialog.

Submit the Job

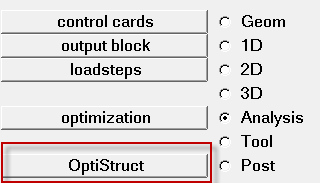
  1. From the Analysis page, click the OptiStruct panel.

    OS_1000_13_17
    Figure 6. Accessing the OptiStruct Panel
  2. Click save as.
  3. In the Save As dialog, specify location to write the OptiStruct model file and enter bracket_transient_modal for filename.
    For OptiStruct input decks, .fem is the recommended extension.
  4. Click Save.
    The input file field displays the filename and location specified in the Save As dialog.
  5. Set the export options toggle to all.
  6. Set the run options toggle to analysis.
  7. Set the memory options toggle to memory default.
  8. Click OptiStruct to launch the OptiStruct job.
If the job is successful, new results files should be in the directory where the bracket_transient_modal.fem was written. The bracket_transient_modal.out file is a good place to look for error messages that could help debug the input deck if any errors are present.
The default files written to the directory are:
bracket_transient_modal.html
HTML report of the analysis, providing a summary of the problem formulation and the analysis results.
bracket_transient_modal.out
OptiStruct output file containing specific information on the file setup, the setup of your optimization problem, estimates for the amount of RAM and disk space required for the run, information for each of the optimization iterations, and compute time information. Review this file for warnings and errors.
bracket_transient_modal.h3d
HyperView binary results file.
bracket_transient_modal.res
HyperMesh binary results file.
bracket_transient_modal.stat
Summary, providing CPU information for each step during analysis process.

View the Results

  1. From the OptiStruct panel, click HyperView to launch HyperView.
  2. From the menu bar, click File > Open > Session.
  3. In the Open Session File dialog, open bracket_transient_modal_tran.mvw from the directory in which the input file was run.
    Since the loading is applied only in the z-direction, you are interested in the z-displacement time history of node 395.
    Plots for the displacement results contained in the file are created.
  4. On the Visualization toolbar, click palette-24 to open the Curves Attributes panel.
  5. Under Curves, individually select the X Trans and Y Trans curves and click Off.

    rd2030_pic6
    Figure 7.
    The X Trans and Y Trans curves are turned off.
  6. Click options-24 to fit the y-axis (that is Z displacement) of node 395.
  7. You can change the color and/or line attributes of the curve, if you wish.

Z-displacement time history of the concentrated mass at center of spider for direct transient dynamic analysis.
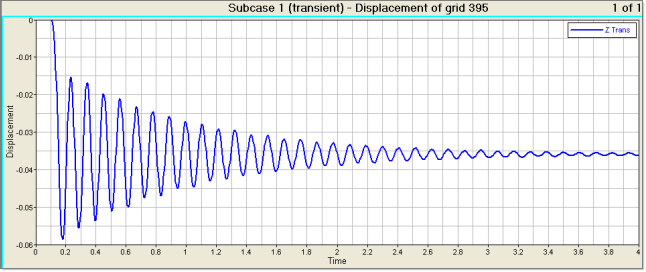
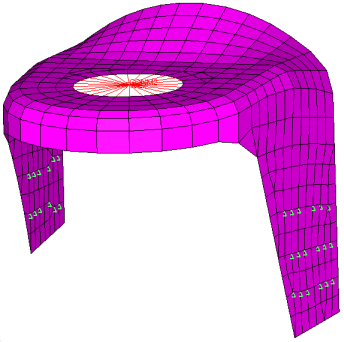
As can be observed from the above image, the displacements of node 395 are in the negative z-direction as the loading is in the -z direction too. The displacements eventually damp out due to the structural damping present in the model.

rd2030_pic7
Figure 8.

© 2022 Altair Engineering, Inc. All Rights Reserved.

Intellectual Property Rights Notice | Technical Support