Sine Sweep Fatigue Analysis
The study of fatigue life of structures under Sinusoidal Loading.
The setup is similar to a Frequency Response Analysis setup, with an additional Fatigue subcase, and additional required Sine Sweep parameters. The LCID field on the FATLOAD entry references the subcase ID of the Frequency Response Analysis subcase.
Frequency Response Stress results from the Frequency Response Analysis are used to calculate the frequency-dependent stress range, which are subsequently used to calculate Fatigue damage based on sweep rate.
Input
Sine sweep is a well-known method of vibration testing which is conducted to evaluate the vibration behavior of a specimen.
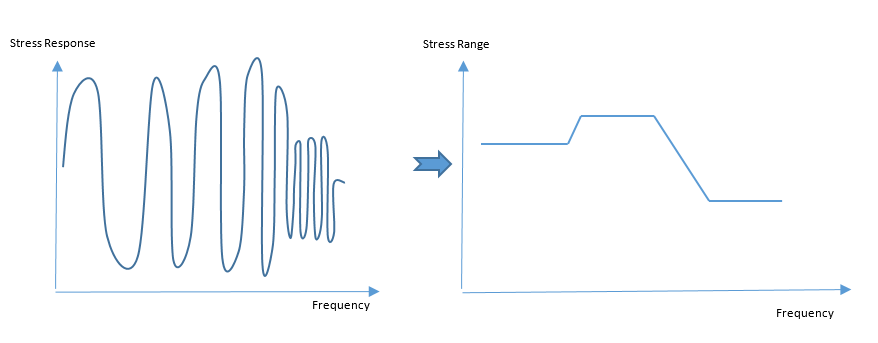
Figure 1. Varying Amplitude Stress Data with Increasing Frequency
- The LCID field on FATLOAD Bulk Data Entry references a Frequency Response Analysis subcase. This Frequency Response subcase provides the input sinusoidal vibration profile that is required to conduct sine sweep fatigue analysis.
- The SWEEP continuation line should be specified on FATLOAD Bulk Data Entry, and corresponding sine sweep parameters, via SR (sweep rate) and SRUNIT (sweep rate unit) fields are required.
- The SWEEP continuation line on the FATPARM Bulk Data Entry can be used to define the frequencies (NF or DF fields) at which the sine sweep fatigue calculations are performed. Additionally, the STSUBID field can be used to identify a static subcase for mean stress correction.
- The N# fields on the FATSEQ Bulk Data Entry identifies the number of sweeps of the corresponding FID# reference and the T# fields define the time in seconds if only a single frequency is considered or if sweep rate is set to 0.0.
- The TYPE field on the FATPARM Bulk Data Entry can be used to identify stress-life (SN) or strain-life (EN) sine sweep fatigue analysis.
Stress-Life
Uses the frequency-based stress range output from Frequency Response Analysis to compile a Damage versus Frequency curve.
The key for Sine Sweep Fatigue Analysis is to find the number of cycles that occur per frequency. Subsequently, the amount of Damage per cycle at a particular frequency can be calculated. This is multiplied by the number of cycles at that frequency to find the total damage per frequency. This is then integrated over the entire frequency range to find the damage per sweep. Fatigue damage for multiple sweeps is just a multiplication of the damage per sweep times the number of sweeps.
Sweep Rate in Hertz Per Second (SRUNIT=HZPS)
- Frequency value of interest (based on NF and DF on FATPARM entry).
- Initial frequency value of loading frequency range from Frequency Response subcase.
- Sweep rate in Hertz per second (SR field on FATLOAD entry).
- Time at which the stress range is applied with a frequency in sine-sweep fatigue.
- Frequency value of interest (based on NF and DF on FATPARM entry).
- Sweep rate in Hertz per second (SR field on FATLOAD entry).
You can see that the number of cycles of a stress range at a particular frequency is equal to . This can be also defined as the rate of change of number of cycles with respect to frequency, at an arbitrary frequency.
- Damage per cycle at frequency
- Damage value corresponding to stress range from the SN curve.
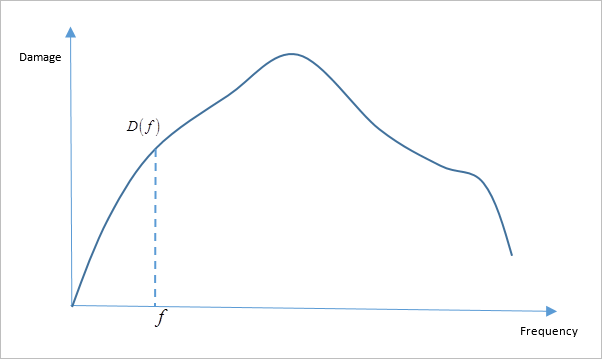
Figure 2. Damage versus Frequency: Area Under this Curve is the Total Damage Per Sweep
Where, is the damage per frequency.
Where, is the total damage per sweep.
Where, is the number of sweeps.
If SR=0.0 (no sweep) or only one loading frequency is defined in the frequency response subcase, then the damage value is calculated for that particular frequency. In the case of SR=0.0, the first loading frequency in the frequency response subcase is used. For the case of a single loading frequency input on frequency response subcase, that particular frequency is chosen. In such cases, the total damage is the damage per frequency multiplied by the total time T# defined on the FATSEQ entry.
Sweep Rate in Octaves Per Minute (SRUNIT=OCTPM)
If the Sweep rate is defined in Octaves per minute, the sweep rate calculation involves a different equation compared to that of Hertz per second.
- Frequency value of interest (based on NF and DF on FATPARM entry).
- Initial frequency value of loading frequency range from Frequency Response subcase.
- Sweep rate in Octvates per minute (SR field on FATLOAD entry).
- Time at which the stress range is applied with a frequency in sine-sweep fatigue.
- Frequency value of interest (based on NF and DF on FATPARM entry).
- Sweep rate in Octvates per minute (SR field on FATLOAD entry).
You can see that the number of cycles of a stress range at a particular frequency is equal to (which can also be defined as the number of cycles per unit frequency, at an arbitrary frequency). Also, from the formula, we can see that for the case of Octaves per minute, the number of cycles of each frequency is independent of the frequency. Therefore, all frequencies have the same number of cycles.
- Damage per cycle at frequency
- Damage value corresponding to stress range from the SN curve.
Where, is the damage per frequency.
Where, is the total damage per sweep.
Where, is the number of sweeps.
If SR=0.0 (no sweep) or only one loading frequency is defined in the frequency response subcase, then the damage value is calculated for that particular frequency. In the case of SR=0.0, the first loading frequency in the frequency response subcase is used. For the case of a single loading frequency input on frequency response subcase, that particular frequency is chosen. In such cases, the total damage is the damage per frequency multiplied by the total time T# defined on the FATSEQ entry.
Strain-Life
Used for vibration based fatigue is calculated based on the damage caused by the highest stress-range.
The process for Strain-life fatigue is similar to that of stress-life, wherein, the characterization of number of cycles versus the stress-range is utilized to calculate the damage due to sine-sweep.
Since loading and unloading path information is lost in vibration analysis, the strain-life approach in vibration fatigue is a conservative extension of the stress-range based data.
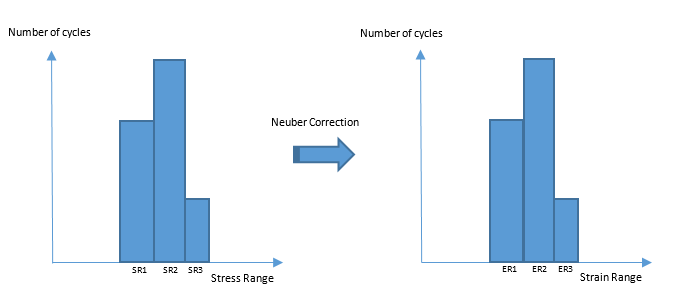
Figure 3. Neuber Correction: Histogram Bar Graph for Cycles versus Stress Range Converted to Cycles versus Strain Range
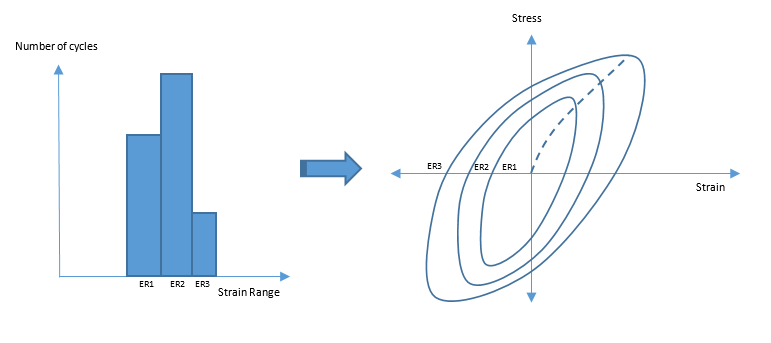
Figure 4. Strain-Range Histogram Illustrated as Stress-Strain Hysteresis Loops
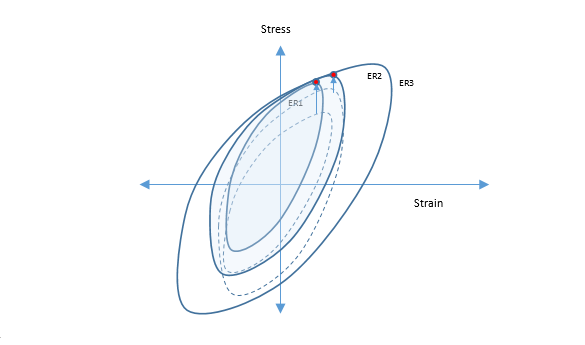
Figure 5. Hanging Lower Strain-Range Hysteresis Loops to the Largest Hysteresis Loop
Using this updated stress strain cycle data, the rest of the sine-sweep procedure continues in the same way as in stress-life sine sweep fatigue analysis.
The SWT or Morrow damage models are used to incorporate the effect of updated stress information (as a result of hanging procedure explained in the previous section). The updated mean stress for the new inner loops is used for Morrow and the updated maximum stress for the new inner loops is used for SWT damage models.
- Damage per cycle at frequency
- Damage value corresponding to strain and updated mean stress from the EN curve.
- Damage per frequency.
- Total damage per sweep.
If SR=0.0 (no sweep) or only one loading frequency is defined in the frequency response subcase, then the damage value is calculated for that particular frequency. In the case of SR=0.0, the first loading frequency in the frequency response subcase is used. For the case of a single loading frequency input on frequency response subcase, that particular frequency is chosen. In such cases, the total damage is the damage per frequency multiplied by the total time T# defined on the FATSEQ entry.