The Well Plot tool cross plots MD, TVD, etcetera, against one or more results along
the well depth typically obtained using the mapping tool. It is used to plot any result on
the well elements (1D elements) along the path of the well.
Load the demo-map.h3d in the HyperView window.
Figure 1.
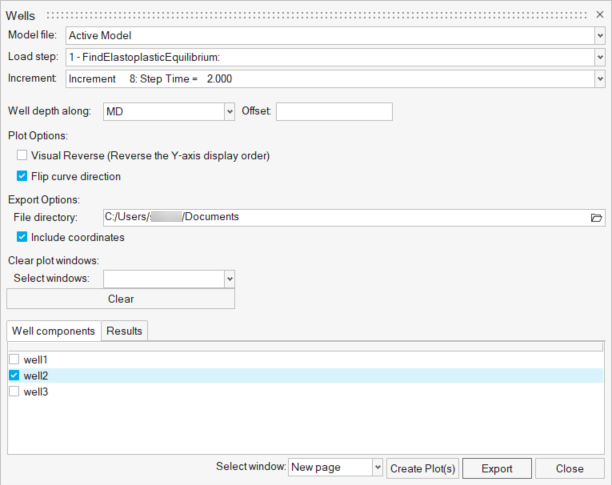
Select the FindElastoplasticEquilibrium subcase from
the Load step list.
Figure 2.
Select Increment 8 simulation check box from
the Simulation increment list.
Select MD from the Well depth along dropdown list.
Click Flip curve direction, to reverse the plot direction.
Depending on the ordering of the wells’ 1D elements, make the plot increase
in-depth, as is traditional.
Choose the File directory path where the well data csv file is to be saved.
Coordinate information is saved if Include coordinates checkbox is
selected.
Select the required 1D Well components for plotting from
the Components table.
Select the required result type to be plotted along the well depth from
the Result table.
Select New page under the window options to plot well data in a new page.
Closing and reopening the wells dialog provides the option of clearing plots
from windows.