Vector Plot Panel
Use the Vector Plot panel to create analysis-based vector plots.
Location: Post page
The vector plot shows the original position of the model and displays vectors at each node indicating the results of the analysis. The color of the vectors corresponds to colors in the legend of the vector plot, and indicates the magnitude of the vectors plotted.
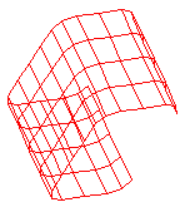 Figure 1. |
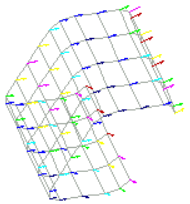 Figure 2. |
The prev or next on the same line as the simulation changes only the simulation. The prev or next on the same line as the data type changes only the data type.
If the simulation or data type is at the first position as found in the results file, clicking prev results in the simulation or data type being assigned to the last position in the file.
If the simulation or data type is at the last position as found in the results file, clicking next results in the simulation or data type being assigned to the first position in the file.
Panel Options
| Option | Action |
|---|---|
| simulation | Select a simulation. |
| data type | Select a data type which can be used to calculate the vectors. |
| title | Specify a title for the plot. |