Plots Panel
Use the Plots panel to create and manage plot collectors.
Location: Post page > XY Plots panel
Using the Plots panel you can create an entirely new plot collector or a new plot based on
default values from an existing plot. If you have complex data, you can create dual
plots to display real/imaginary or phase/magnitude curve data. You can also select
the curves that are to be displayed on the plot.
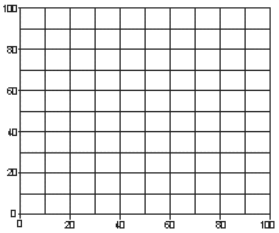 Figure 1. Standard Plot |
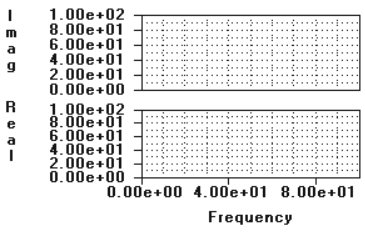 Figure 2. Dual Plot |
Panel Options
| Option | Action |
|---|---|
| plot = | Specify a name for the plot collector. |
| like = | Click to select an existing plot whose default values you want to use for the new plot. |
| standard / real/imag / phase/mag | Select a method for
creating plots.
Note: After you create a real/imag or phase/mag plot, the
standard selection is removed from the menu.
|
Command Buttons
| Button | Action |
|---|---|
| create plot | Create a new plot based on the current inputs. |
| select curves | Select the curves to
display. After you click return, the
curves you selected are displayed in the plot.
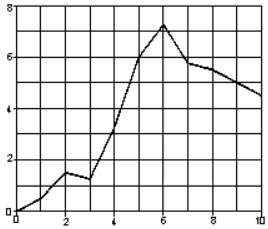 Figure 3. |
| return | Exit the panel. |