Edit Curves Panel
Use the Edit Curves panel to create new curves or edit existing ones.
Location: Post page > xy plots panel
Each vector can be defined using either a data file or a math expression. For example, the data source for the x vector could be a file, and the data source for the y vector could be a math expression. The data sources for the x and y vectors are displayed in the x = and y = fields.
Create Subpanel
| Option | Action |
|---|---|
| plot | Select the plot on which to create the curve. An untitled plot is created if no plot currently exists. |
| x / y | Display the data sources for the x and y vectors once they are selected. |
| file | Browse to a file that contains your curve data. |
| type |
Select a data type.
Note: Only available when file is
selected.
|
| req | Select a data request set. |
| comp | Select a component. |
| math |
Use
a math expression for your curve data.
Note: The math expression must evaluate to an
array.
|
Modify Subpanel
Use the Modify subpanel to edit an existing curve by changing the data source for the x or y vector or by applying a mathematical expression.
- c1.x
- To reference the x vector of curve 1.
- c1.y
- To reference the y vector of curve 1.
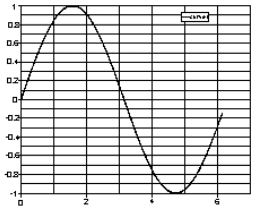
- x = 0:6.14:.01
- y = sin (x)

Figure 1. Example 1: Edit Curves
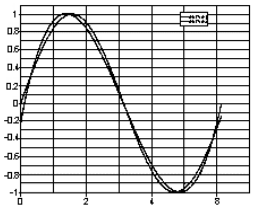
- x = c1.x
- y = polyfit(c1.x, c1.y, 3)

Figure 2. Example 2: Edit Curves
| Option | Action |
|---|---|
| curve | Select the curve to modify. |
| x / y | Display the data sources for the x and y vectors once they are selected. |
| file | Browse to a file that contains your curve data. |
| type |
Select a data type.
Note: Only available when file is
selected.
|
| req | Select a data request set. |
| comp | Select a component. |
| math |
Use
a math expression for your curve data.
Note: The math expression must evaluate to an
array.
|